

Bioinformatics analysis of hub genes as osteoarthritis prognostic biomarkers
- PMID: 38129488
- PMCID: PMC10739719
- DOI: 10.1038/s41598-023-48446-1
Bioinformatics analysis of hub genes as osteoarthritis prognostic biomarkers
Abstract
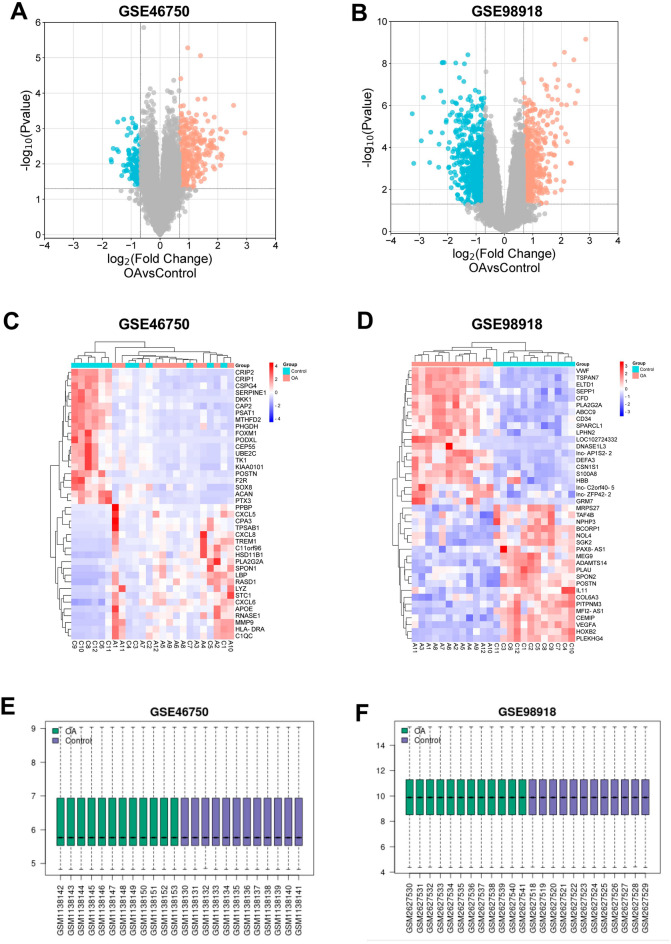
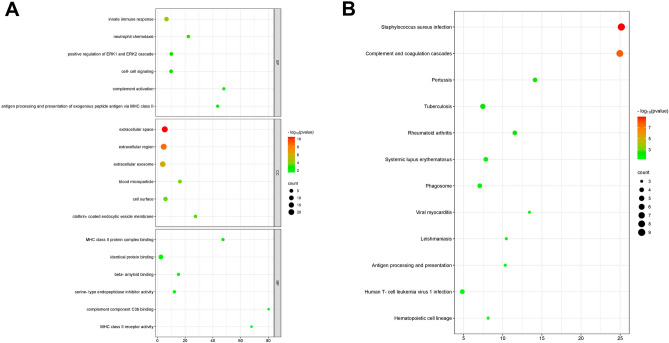
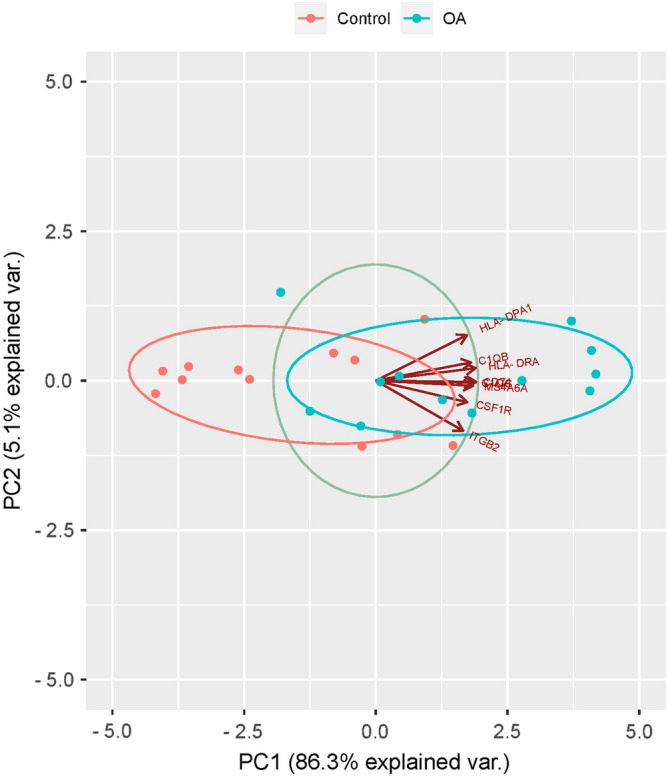
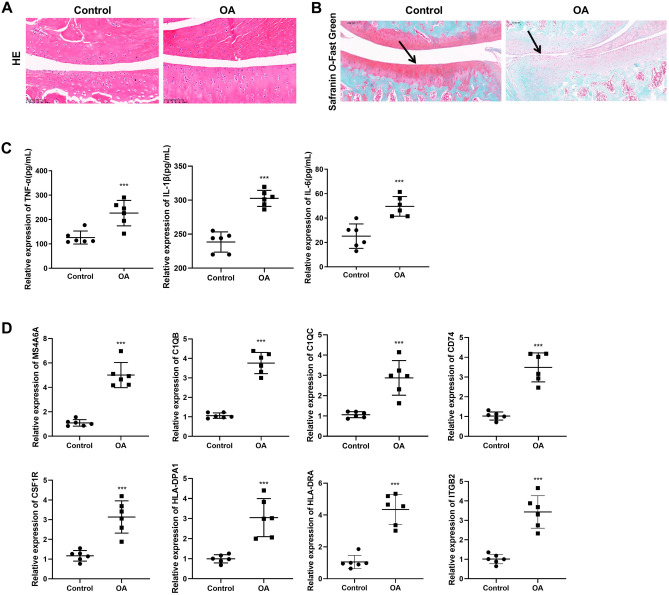
Osteoarthritis (OA) is a progressive cartilage degradation disease, concomitant with synovitis, osteophyte formation, and subchondral bone sclerosis. Over 37% of the elderly population is affected by OA, and the number of cases is increasing as the global population ages. Therefore, the objective of this study was to identify and analyze the hub genes of OA combining with comprehensive bioinformatics analysis tools to provide theoretical basis in further OA effective therapies. Two sample sets of GSE46750 contained 12 pairs OA synovial membrane and normal samples harvested from patients as well as GSE98918 including 12 OA and non-OA patients were downloaded from the Gene Expression Omnibus database (GEO) database. Differentially expressed genes (DEGs) were identified using Gene Expression Omnibus 2R (GEO2R), followed by functional enrichment analysis, protein-protein interaction networks construction. The hub genes were identified and evaluated. An OA rat model was constructed, hematoxylin and eosin staining, safranin O/fast green staining, cytokines concentrations of serum were used to verify the model. The hub genes expression level in the knee OA samples were verified using RT-qPCR. The top 20 significantly up-regulated and down-regulated DEGs were screened out from the two datasets, respectively. The top 18 GO terms and 10 KEGG pathways were enriched. Eight hub genes were identified, namely MS4A6A, C1QB, C1QC, CD74, CSF1R, HLA-DPA1, HLA-DRA and ITGB2. Among them, the hub genes were all up-regulated in in vivo OA rat model, compared with healthy controls. The eight hub genes identified (MS4A6A, C1QB, C1QC, CD74, CSF1R, HLA-DPA1, HLA-DRA and ITGB2) were shown to be associated with OA. These genes can serve as disease markers to discriminate OA patients from healthy controls.
© 2023. The Author(s).
Conflict of interest statement
The authors declare no competing interests.
Figures


Similar articles
-
Identification of Key Diagnostic Markers and Immune Infiltration in Osteoarthritis.Comb Chem High Throughput Screen. 2023;26(2):410-423. doi: 10.2174/1386207325666220426083526. Comb Chem High Throughput Screen. 2023. PMID: 35473522 Free PMC article.
-
Identification and Verification of Endoplasmic Reticulum Stress-Related Genes as Novel Signatures for Osteoarthritis Diagnosis and Therapy: A Bioinformatics Analysis-Oriented Pilot Study.Biochem Genet. 2025 Jun;63(3):2312-2329. doi: 10.1007/s10528-024-10818-1. Epub 2024 May 11. Biochem Genet. 2025. PMID: 38734758
-
Identification of osteoarthritis-associated chondrocyte subpopulations and key gene-regulating drugs based on multi-omics analysis.Sci Rep. 2025 Apr 11;15(1):12448. doi: 10.1038/s41598-025-90694-w. Sci Rep. 2025. PMID: 40216809 Free PMC article.
-
Identification of differential key biomarkers in the synovial tissue between rheumatoid arthritis and osteoarthritis using bioinformatics analysis.Clin Rheumatol. 2021 Dec;40(12):5103-5110. doi: 10.1007/s10067-021-05825-1. Epub 2021 Jul 5. Clin Rheumatol. 2021. PMID: 34224029
-
CD14 and CSF1R as developmental molecular targets for the induction of osteoarthritis.Int J Clin Exp Pathol. 2023 Aug 15;16(8):184-198. eCollection 2023. Int J Clin Exp Pathol. 2023. PMID: 37693684 Free PMC article.
Cited by
-
The role of mitochondrial autophagy in osteoarthritis.iScience. 2024 Aug 15;27(9):110741. doi: 10.1016/j.isci.2024.110741. eCollection 2024 Sep 20. iScience. 2024. PMID: 39280604 Free PMC article.
-
Identification of Genes Linked to Meniscal Degeneration in Osteoarthritis: An In Silico Analysis.Int J Mol Sci. 2025 Jul 11;26(14):6651. doi: 10.3390/ijms26146651. Int J Mol Sci. 2025. PMID: 40724902 Free PMC article.
-
DNA methylation of bone morphogenetic protein 7 in leukocytes as a possible biomarker for hand osteoarthritis: A pilot study.J Orthop Res. 2025 Jan;43(1):84-93. doi: 10.1002/jor.25963. Epub 2024 Aug 25. J Orthop Res. 2025. PMID: 39182186 Free PMC article.
-
CSF1-R inhibition attenuates posttraumatic osteoarthritis and quadriceps atrophy following ligament injury.J Physiol. 2024 Dec 22:10.1113/JP286815. doi: 10.1113/JP286815. Online ahead of print. J Physiol. 2024. PMID: 39709528
-
Screening core genes for minimal change disease based on bioinformatics and machine learning approaches.Int Urol Nephrol. 2025 Feb;57(2):655-671. doi: 10.1007/s11255-024-04226-y. Epub 2024 Oct 9. Int Urol Nephrol. 2025. PMID: 39382604
References
-
- Roemer FW, Guermazi A, Felson DT, Niu J, Nevitt MC, Crema MD, Lynch JA, Lewis CE, Torner J, Zhang Y. Presence of MRI-detected joint effusion and synovitis increases the risk of cartilage loss in knees without osteoarthritis at 30-month follow-up: The MOST study. Ann. Rheum. Dis. 2011;70(10):1804–1809. doi: 10.1136/ard.2011.150243. - DOI - PMC - PubMed
-
- Hill CL, Hunter DJ, Niu J, Clancy M, Guermazi A, Genant H, Gale D, Grainger A, Conaghan P, Felson DT. Synovitis detected on magnetic resonance imaging and its relation to pain and cartilage loss in knee osteoarthritis. Ann. Rheum. Dis. 2007;66(12):1599–1603. doi: 10.1136/ard.2006.067470. - DOI - PMC - PubMed
MeSH terms
Substances
LinkOut - more resources
Full Text Sources
Research Materials
Miscellaneous
