. 2024 Jan;21(1):132-141.
doi: 10.1038/s41592-023-02098-1. Epub 2023 Dec 21.

The Cousa objective: a long-working distance air objective for multiphoton imaging in vivo

Affiliations

The Cousa objective: a long-working distance air objective for multiphoton imaging in vivo

Che-Hang Yu et al. Nat Methods. 2024 Jan.

Abstract

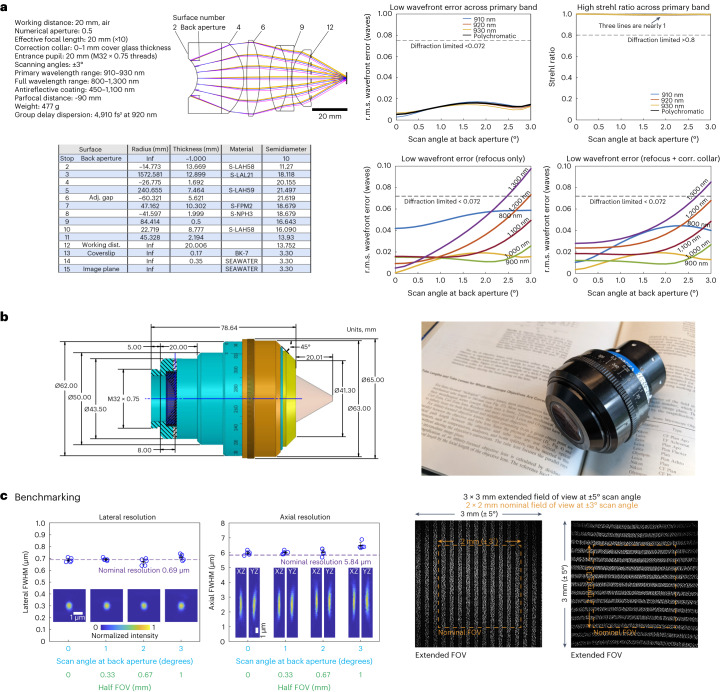
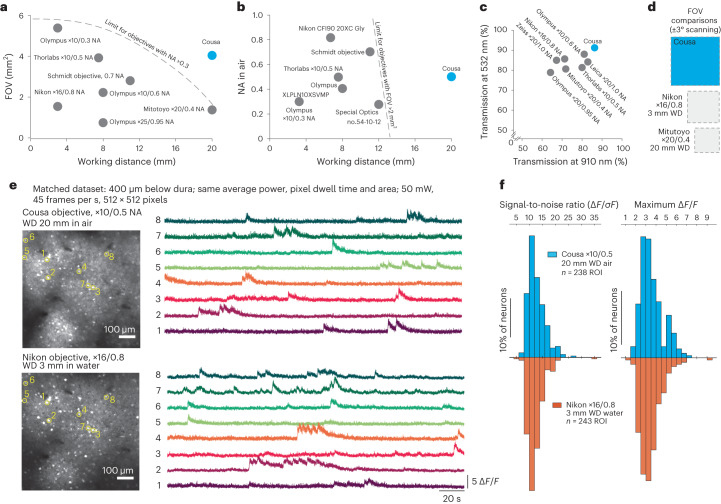
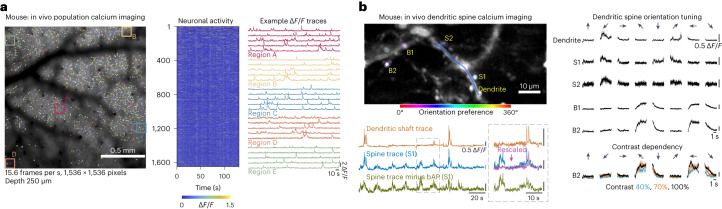
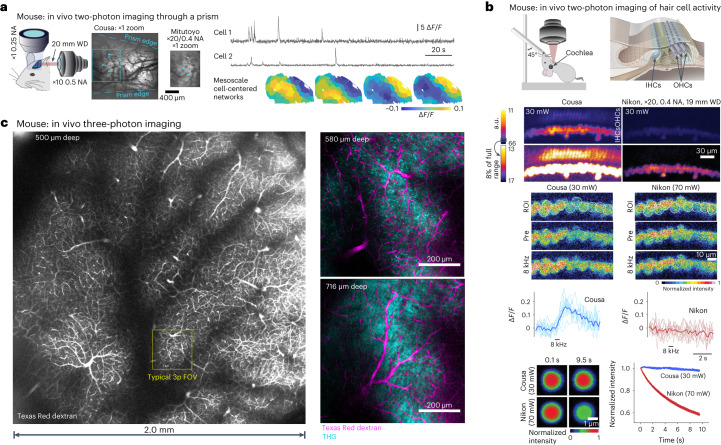
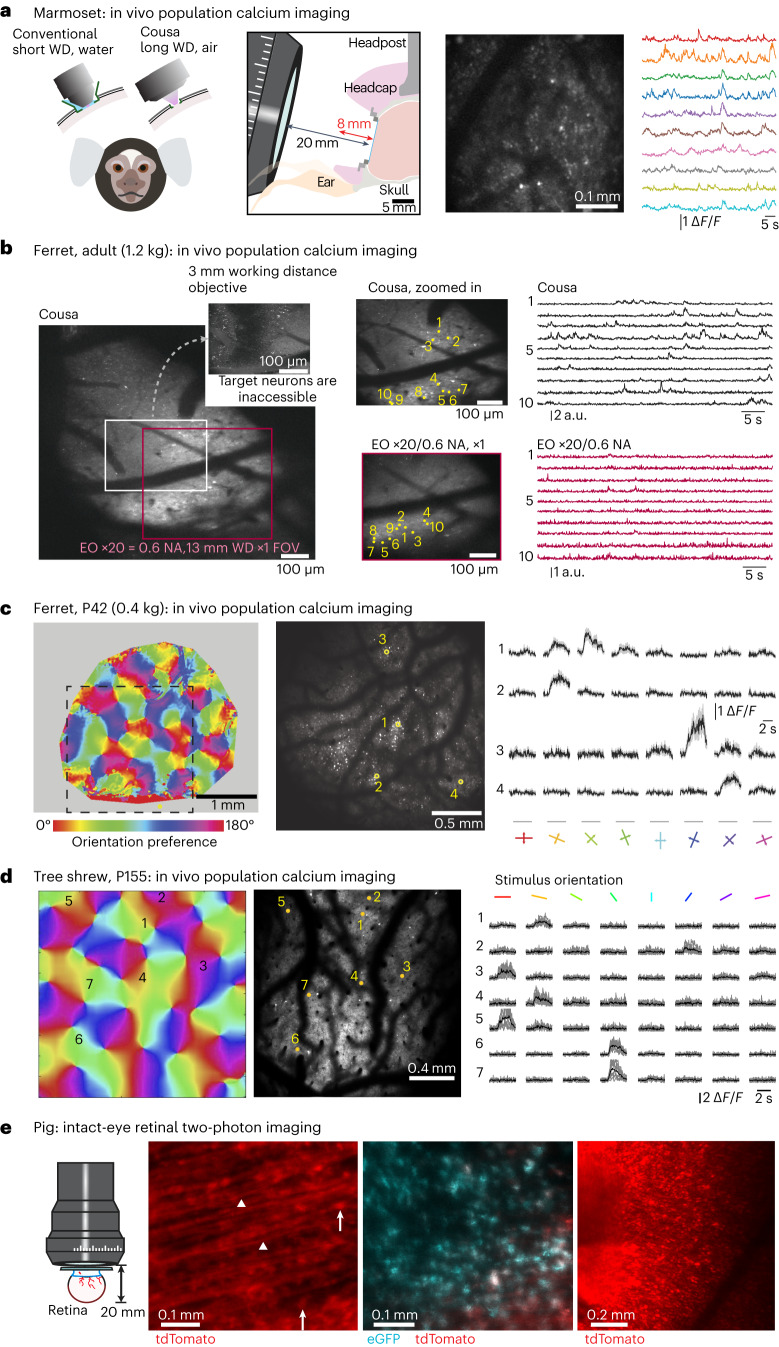
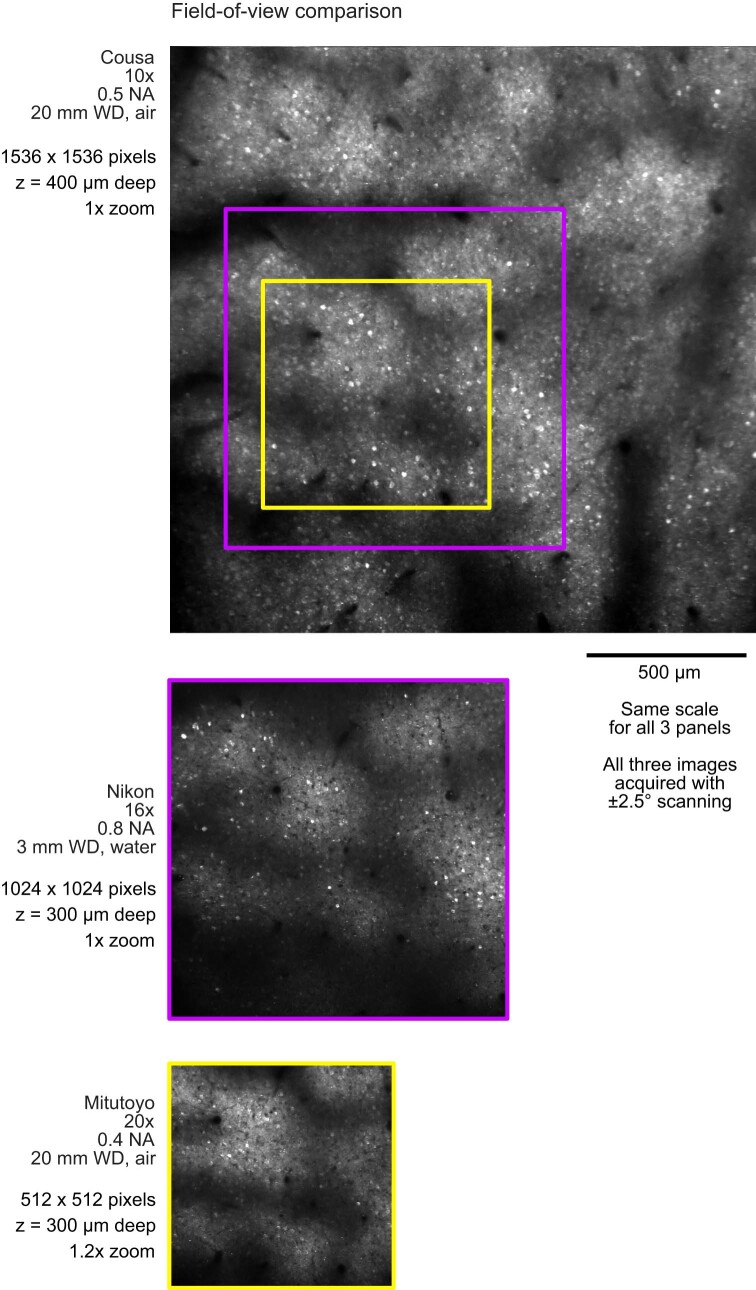
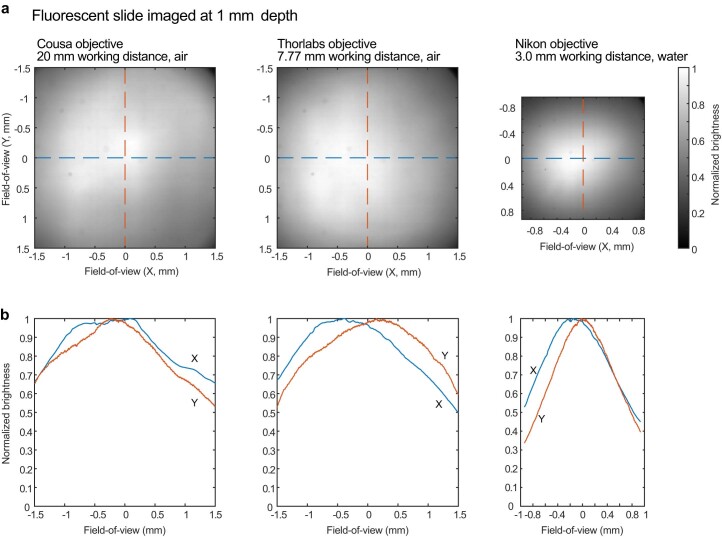
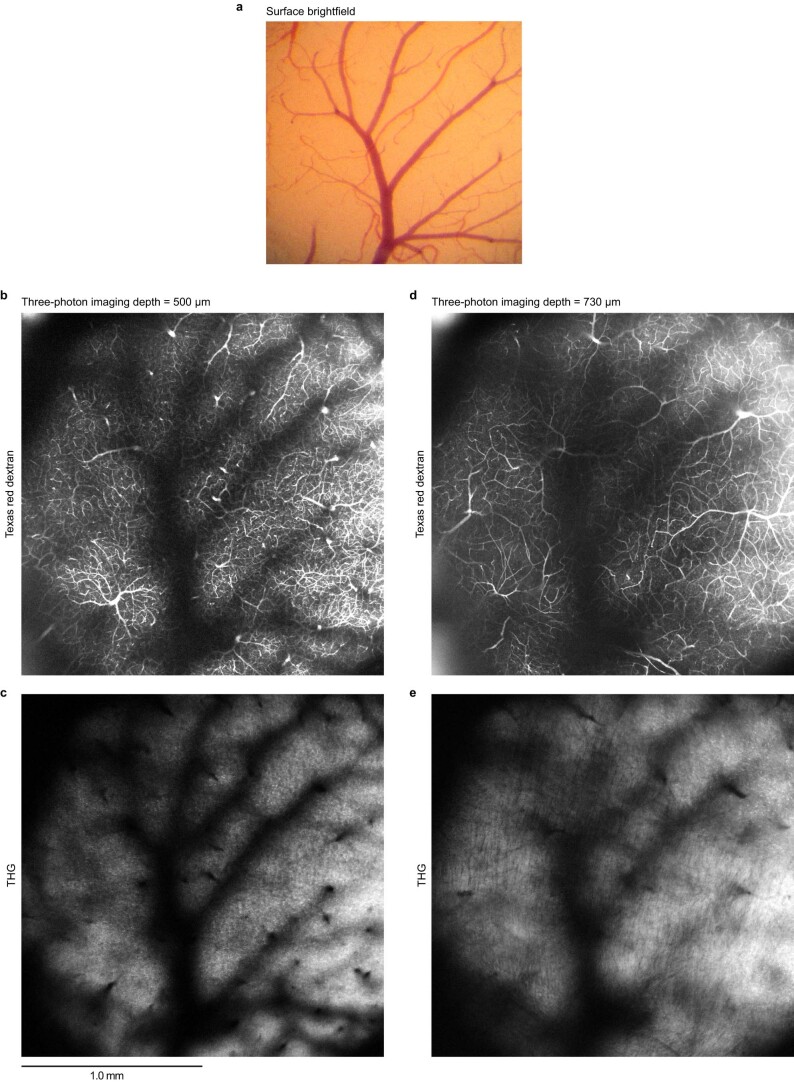
Multiphoton microscopy can resolve fluorescent structures and dynamics deep in scattering tissue and has transformed neural imaging, but applying this technique in vivo can be limited by the mechanical and optical constraints of conventional objectives. Short working distance objectives can collide with compact surgical windows or other instrumentation and preclude imaging. Here we present an ultra-long working distance (20 mm) air objective called the Cousa objective. It is optimized for performance across multiphoton imaging wavelengths, offers a more than 4 mm2 field of view with submicrometer lateral resolution and is compatible with commonly used multiphoton imaging systems. A novel mechanical design, wider than typical microscope objectives, enabled this combination of specifications. We share the full optical prescription, and report performance including in vivo two-photon and three-photon imaging in an array of species and preparations, including nonhuman primates. The Cousa objective can enable a range of experiments in neuroscience and beyond.


Conflict of interest statement

The design of the objective is not patented, and it will not be patented in the future. All designs originating in this report are free for reuse, no licensing or material transfer agreements are required. Notification is not required either, but only humbly requested. S.L.S. is a paid consultant for companies that sell optics and multiphoton microscopes. C.-H.Y. and S.L.S. have interests in the company Pacific Optica. The other authors declare no competing interests.

Figures

Fig. 1
Fig. 1. Design and benchmarking.
a, Left: the specifications that constrained the design to ensure compatibility with two-photon imaging systems that are typically used in vivo. The resulting optical design has six elements and one adjustable air gap (adjustment range 5.4–6.0 mm) to optimize performance. The full lens prescription is provided. Right: the primary optimizations were for 920 ± 10 nm for two-photon excitation of GFP-based indicators. The optical model predicts low r.m.s. wavefront errors and high Strehl ratios for 910, 920 and 930 nm light across the scan angles of 0–3°, well beyond the diffraction limit. Performance is also diffraction-limited across a broader wavelength range from 800 to 1,300 nm. The r.m.s. wavefront error remains below the diffraction limit for most of the 0–3° scan angle range, when the focal plane is allowed to naturally shift with wavelength, and the correction (corr.) collar provides an additional degree of optimization. b, Left: the mechanical design of the objective prioritized keeping the widest diameter near the middle of the objective to avoid mechanical collisions with objective mounts. All dimensions are in mm unless otherwise noted. Right: a photograph of the manufactured objective. c, Left: two-photon excitation PSF measurements were made with 0.2 µm beads embedded in agar at a depth of 350 µm. The excitation wavelength is 910 nm. z stack images are acquired for beads at four lateral locations including on axis, 1°, 2° and 3° off axis (n = 5 beads at each location). FWHM of the Gaussian fits for measurements (mean values ± s.d.) indicate lateral and axial resolutions indistinguishable from diffraction-limited resolutions. The pixel size of the images is 0.058 × 0.064 × 0.69 µm3 (xyz). Right: images of a fluorescent calibration sample with a periodic line pattern (five lines per millimeter) in two orientations acquired under a ±5° scan angle show a nominal 2 × 2 mm2 FOV of the objective under the ±3° scan angle, and a 3 × 3 mm2 FOV under ±5° scan angle.
Fig. 2
Fig. 2. Categorical and quantitative comparisons.
a, Conventional objectives are constrained to a mechanical envelope that limits the product of FOV and WD. The general limits imposed by this mechanical envelope are sketched with dotted lines. The Cousa objective is distinctive in that it combines an ultra-long WD of 20 mm with a large FOV and an NA of 0.5. b, Conventional objectives that can offer a FOV >2 mm2 are typically constrained to shorter WD. The Cousa has a long WD, and provides more than 4 mm2 FOV. c, Overall throughput in both near IR (910 nm) and visible (532 nm) wavelengths is higher with the Cousa than conventional objectives. This is potentially due to a lower number of lenses in the Cousa. d, The FOV of the Cousa dwarfs both a commonly used short WD low magnification multiphoton objective (Nikon ×16/0.8 NA) and a conventional long WD objective (Mitutoyo ×20/0.4 NA). e, In vivo calcium dynamics (GCaMP6s) are measured with the Cousa objective and a popular water immersion objective (Nikon ×16/0.8 NA) and compared. The exact same imaging parameters are used to image the same field of neurons in the same mouse (awake, spontaneous activity). Averaged images for both objectives are shown on the left. Calcium traces from the identical ROI are shown on the right (raw data at 45 frames per s; no filtering). The data quality of the Cousa objective is similar to that of this commonly used short WD objective (Nikon ×16/0.8 NA). f, The signal-to-noise ratio and maximum ΔF/F of the calcium dynamic for each ROI in e are calculated and plotted as histograms for both objectives. The signal-to-noise ratio for each ROI is the ratio of the maximal magnitude of the calcium trace to the standard deviation of the fluctuating signal around the baseline. The maximum ΔF/F for each ROI is the maximal value of ΔF/F throughout the trace. Thus, the Cousa provides an ultra-long WD in air, a large FOV and raw data similar to those from conventional objectives.
Fig. 3
Fig. 3. Two-photon calcium imaging of soma, dendrites, spines and boutons.
a, Population calcium imaging (GCaMP6s) over a 1.7-mm-wide FOV. Traces from cells within boxes at left are expanded at right, a selection of the 1,648 neurons detected in this dataset. b, In a mouse with ultra-sparse expression of GCaMP8m in V1, we imaged calcium transients in putative axonal boutons (B), dendritic spines (S) and dendritic shafts during the presentation of visual stimuli (drifting gratings). Color codes show the orientation preference of each ROI. bAP-associated calcium transients detected in the dendrite were subtracted from the dendritic spine S1 signal, revealing activity events that are independent from local bAP signals, indicative of local synaptic input. Orientation tuned responses were reliable for spines S1 and S2, boutons B1 and B2, and the nearby dendrite (n = 15 repeats per stimulus; mean in black ± s.e.m. in gray). Responses in axonal bouton B2 varied with contrast (contrast levels of 40% in blue, 70% in orange and 100% in black; mean ± s.e.m.; n = 5 repeats).
Fig. 4
Fig. 4. Two-photon and three-photon imaging in mice.
a, Simultaneous two-photon imaging (through a prism) and mesoscopic wide-field imaging in awake, head-fixed mice obtained a larger FOV with the Cousa. Time-averaged two-photon image obtained through the prism show the difference in FOV compared with a commercially available 20 mm air objective. Time series for neurons imaged with two-photon excitation through the Cousa objective and microprism were used to detect cell-centered networks for 74 neurons in one mouse. b, Top: the Cousa objective enables in vivo functional imaging of cochlear hair cells. The mouse is held supine for imaging of IHCs and OHCs. We imaged with both the Cousa objective and a conventional objective, the Nikon ×20/0.4 NA, 19 mm WD (TU Plan ELWD 20X), with the same laser power (30 mW). Middle: for calcium imaging in IHCs, the Cousa was used with 30 mW and the Nikon was used with 70 mW, to obtain minimal usable signal levels for both at 5.7 frames per s. In response to sound stimulation, IHCs exhibited responses only during Cousa imaging. Bottom: fluorescent particles (diameter 5.63 µm) faded rapidly when imaged with the Nikon, and maintained fluorescence when imaged with the Cousa. a.u., arbitrary units. c, Left: the Cousa supports large FOV three-photon imaging, with a 20 mm WD. The vasculature across the entire 4 mm2 region is visible after an intravenous injection of Texas Red dextran. Right: higher zoom single z plane three-photon images from a second mouse with dual channel imaging of Texas Red dextran (magenta) and THG (cyan) in cortex and white matter.
Fig. 5
Fig. 5. Two-photon imaging in larger mammals.
a, In behaving marmosets, the Cousa objective facilitates imaging by replacing water immersion with air and providing ample open space around the cranial window. b, In ferrets, it can be challenging to access the neurons of interest. A short WD objective (Nikon ×16/0.8 NA, 3 mm WD in water) cannot even access the neurons of interest due to the short WD and collisions with the walls of the cranial window. The Cousa provides a large FOV and activity measurement, another long WD air objective provides only a smaller FOV (at a different angle) and weaker signals. Imaging depth is roughly 300 µm. c, In ferrets, with another type of imaging window, the Cousa provides a large FOV for measuring orientation tuning across orientation columns. d, Similarly, in tree shrew, the Cousa provides a large FOV for resolving individual neurons across orientation domains. e, In a challenging preparation, the Cousa enabled two-photon imaging through the lens and entire eye to the retina of an intact porcine eye, including retinal ganglion cell bodies (arrows) and single axon fibers (triangles).
Extended Data Fig. 1
Extended Data Fig. 1. Field distortion.
The diagram shows the distortion of the field of view simulated from the Zemax model. The blue grid shows the undistorted (square) FOV for comparison. The orange grid shows the shape of the FOV for the Cousa objective, showing a pincushion distortion. The yellow grid shows the shape of the FOV formed by the sum of the Diesel2p scan engine and the Cousa objective, showing a combination of the pincushion and barrel distortion. The shape of the simulated distortion (in yellow) matches with the distortion of the experimental measurement shown in Fig. 1c. Note that there is nearly zero field distortion in the 2 × 2 mm2 nominal FOV (dashed black square).
Extended Data Fig. 2
Extended Data Fig. 2. Collection light path.
A schematic shows the ray-traces in the collection light path for the Cousa objective. Fluorescence photons with wavelengths in the visible band (450 nm, 550 nm, and 650 nm) are emitted from the imaging plane within the 2 mm nominal FOV (zoom in view on the left), passing through the Cousa objective. These photons are further collected and guided by the optical relay, and reach at the cathode of the photomultiplier (PMT). The optical relay is constructed simply with two off-the-shelf singlet lenses from OptoSigma (011-2570-a55) and Thorlabs (LA1805-A). The zoom in view in the bottom-right shows that all of the emitted photons (rays) in the visible spectrum reach at the detector surface within a 3 mm wide spread.
Extended Data Fig. 3
Extended Data Fig. 3. Additional information on performance.
Additional information on nominal performance. (a) The spot diagram shows the distribution of rays at the imaging plane coming from a scan angle of 0°, 1°, 2°, 3°, 4°, 5°, aiming at the objective’s back aperture with a beam diameter of 20 mm, and with wavelengths of 910 nm, 920 nm, and 930 nm. (b) The simulated point spread functions from Zemax at the 5 scan angles are shown. The root-mean-square wavefront error (c) and the Strehl ration (d) as a function the scan scan angle at the back aperture is shown for the wavelength of 910 nm, 920 nm, 930 nm, and all three combined (polychromatic). The horizontal dashed line indicates that the curve below 0.072 in the RMS wavefront error plot and above 0.8 in the Strehl plot is diffraction limited. The vertical dashed line in (c) and (d) shows the nominal range of scan angle is smaller than 3 degrees. (e) The dependence of focal shift on the wavelength in the center of FOV is shown. (f) The depth of the tangential and sagittal focus over a scan angle of 5 degrees at 920 nm is shown. The horizontal dashed line shows the nominal range of the scan angle < 3°. There is only 4 µm depth difference in the center (0°) and in the edge (3°) of the FOV within the nominal scan range.
Extended Data Fig. 4
Extended Data Fig. 4. Thickness of air gaps for optimal performance at different wavelengths.
The nominal thicknesses of air gaps used for different wavelengths. The upper portion of table lists the distance of the objective-to-sample gap (Surface 12) when this single air gap is adjusted for different wavelengths. The lower part of the table shows the thicknesses of the objective-to-sample gap (Surface 12) and the correction collar gap (Surface 6) when both of these two air gaps are adjusted.
Extended Data Fig. 5
Extended Data Fig. 5. Focusing 1040 nm light.
Across scan angles from 0 to 3 degrees, the focus of 1040 nm light is < 0.8 µm laterally and < 7.0 µm axially.
Extended Data Fig. 6
Extended Data Fig. 6. Dependence of performance on the imaging depth and refractive index of the sample medium as well as the compensation using the correction collar.
The root-mean-squared (RMS) wavefront error (top) and the Strehl ratio (bottom) as a function of the scan angle at the back aperture at different imaging depths inside seawater (n = 1.33) are shown with the correction collar fixed at an air gap of 5.622 mm in (a), and with the correction collar optimized for different imaging depths in (b). Different imaging depths ranging from 150-550 µm are color coded. The same plots inside an index-matching medium (n = 1.46) are shown as (a) with the correction collar fixed at an air gap of 5.622 mm in (c), and with the correction collar optimized for different imaging depths in (d).
Extended Data Fig. 7
Extended Data Fig. 7. Dependence of performance on coverslips of different thickness and the compensation using the correction collar.
The root-mean-squared (RMS) wavefront error (top) and the Strehl ratio (bottom) as a function of the scan angle at the back aperture and coverslips of different thickness are shown with the correction collar fixed at an air gap of 5.622 mm in (a), and with the correction collar optimized for coverslips of different thickness in (b). The thickness of coverslips ranging from 0-1000 µm are color coded. (c) The schematic shows the Cousa objective focuses light through a 0.17 mm thick coverslip and 0.35 mm of seawater. The optical thickness of the non-air elements between the objective and the focal plane can be calculated: multiply the thickness of a material (ignoring air) in millimeters by its refractive index, and sum over all of these products. For example, the optical thickness shown in the schematic is 0.723 (0.17 mm × 1.509 + 0.35 mm × 1.333). The table below shows combinations of the coverslip thickness and the seawater thickness, and the resultant optical thickness for each combination. The correction collar can be adjusted to compensate for the optical thickness over the range of 0 - 2 mm, and maintain the diffraction-limited performance. (d) The root-mean-squared (RMS) wavefront error (top) and the Strehl ratio (bottom) as a function of the scan angle at the back aperture are shown when the correction collar is optimized for different optical thickness of non-air materials. Each curve is color coded for different optical thickness shown as the number before the parenthesis. The number in the parenthesis is the optimal thickness of air gap to achieve the best optical performance.
Extended Data Fig. 8
Comparing the field-of-view (FOV) between the Cousa and two conventional objectives.
Extended Data Fig. 9
Extended Data Fig. 9. Field uniformity compared among three objectives.
(a) Images of a fluorescent slide at 1 mm depth using the Cousa, the Thorlabs 10x/0.5NA, and the Nikon 16x/0.8NA objectives with the laser beam scanning ±5° at the back aperture. The brightness of each image was normalized to the peak brightness, individually. Scan angles of ±5° correspond to a ~ 3 mm-wide field-of-view for the Cousa and Thorlabs 10x objectives, and a ~ 1.8 mm-wide field-of-view for the Nikon 16x objective. (b) The profiles of normalized brightness along the colored, dashed lines in (a). Note that the Cousa and the Thorlabs 10x/0.5NA have similar field uniformity, despite the Cousa being >12 mm further from the focal plane. The field brightness drops off rapidly from the center for the Nikon 16x/0.8NA objective.
Extended Data Fig. 10
Extended Data Fig. 10. Large field-of-view three-photon imaging with the Cousa objective.
(a) Brightfield image of a craniotomy over the mouse visual cortex, viewed through a surgical dissecting microscope. No dyes were present in the circulation at this phase of the experiment. Arteries and veins can be distinguished based on small difference in hue—arteries shown in orange and veins in purple. (b,c) Single z plane three-photon images (dual channel recording) from mouse visual cortex, 500 µm below the pial surface showing blood vessels labeled with Texas Red dextran (panel b) and THG signals (panel c). (d, e) Single z plane three-photon images (dual channel recording) from mouse visual cortex, 730 µm below the pial surface showing blood vessels labeled with Texas Red dextran (panel d) and THG signals (panel e).

References

    1. Trautmann EM, et al. Dendritic calcium signals in rhesus macaque motor cortex drive an optical brain-computer interface. Nat. Commun. 2021;12:3689. - PMC - PubMed
    1. Heider B, Nathanson JL, Isacoff EY, Callaway EM, Siegel RM. Two-photon imaging of calcium in virally transfected striate cortical neurons of behaving monkey. PLoS ONE. 2010;5:e13829. - PMC - PubMed
    1. Li M, Liu F, Jiang HF, Lee TS, Tang SM. Long-term two-photon imaging in awake macaque monkey. Neuron. 2017;93:1049–104. - PubMed
    1. Macknik SL, et al. Advanced circuit and cellular imaging methods in nonhuman primates. J. Neurosci. 2019;39:8267–8274. - PMC - PubMed
    1. Smith GB, Fitzpatrick D. Viral injection and cranial window implantation for in vivo two-photon imaging. Methods Mol Biol. 2016;1474:171–185. - PubMed

MeSH terms

Substances