. 2023 Dec 21;6(1):1298.
doi: 10.1038/s42003-023-05665-6.

Chromatin regulator SMARCAL1 modulates cellular lipid metabolism

Affiliations

Chromatin regulator SMARCAL1 modulates cellular lipid metabolism

Taylor Hanta Nagai et al. Commun Biol. .

Abstract

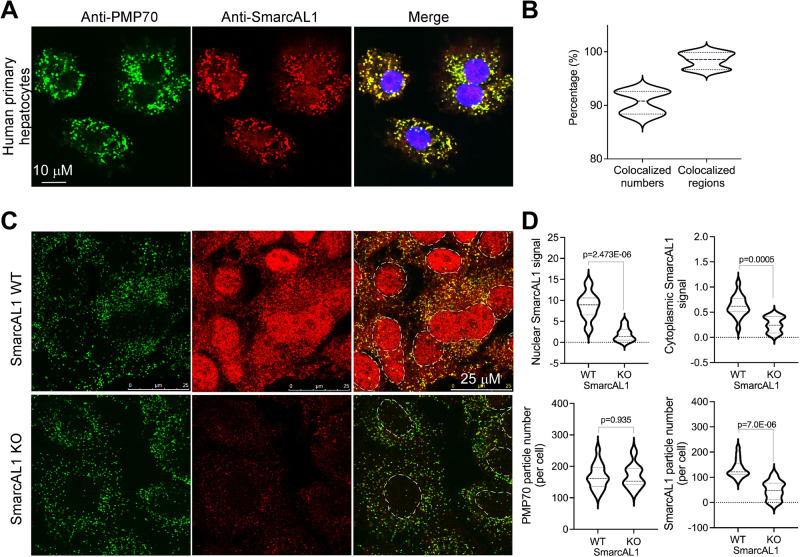
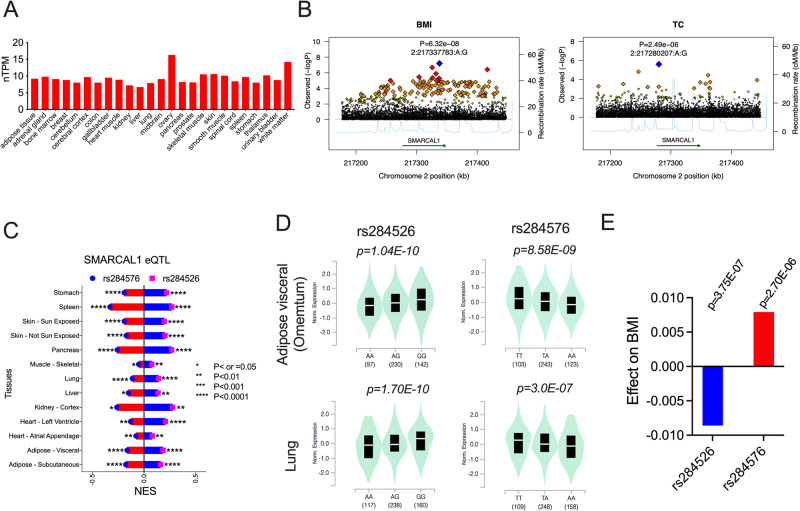
Biallelic mutations of the chromatin regulator SMARCAL1 cause Schimke Immunoosseous Dysplasia (SIOD), characterized by severe growth defects and premature mortality. Atherosclerosis and hyperlipidemia are common among SIOD patients, yet their onset and progression are poorly understood. Using an integrative approach involving proteomics, mouse models, and population genetics, we investigated SMARCAL1's role. We found that SmarcAL1 interacts with angiopoietin-like 3 (Angptl3), a key regulator of lipoprotein metabolism. In vitro and in vivo analyses demonstrate SmarcAL1's vital role in maintaining cellular lipid homeostasis. The observed translocation of SmarcAL1 to cytoplasmic peroxisomes suggests a potential regulatory role in lipid metabolism through gene expression. SmarcAL1 gene inactivation reduces the expression of key genes in cellular lipid catabolism. Population genetics investigations highlight significant associations between SMARCAL1 genetic variations and body mass index, along with lipid-related traits. This study underscores SMARCAL1's pivotal role in cellular lipid metabolism, likely contributing to the observed lipid phenotypes in SIOD patients.


Conflict of interest statement

The authors declare the following competing interests: D.J.R. serves on scientific advisory boards for Alnylam, Novartis, Pfizer, and Verve. C.A.C. is a founder and Chief Scientific Officer of Sana Biotechnology. The other authors declare no competing interests.

Figures

Fig. 1
Fig. 1. SmarcAL1 interacts with lipoprotein regulator Angptl3.
A Schematic representation of SILAC (Stable Isotope Labeling by Amino acids in Cell culture) proteomics workflow. B Proteomic analysis of Angptl3-interacting proteins. Extracts of Fc and Fc-Angptl3 McA cells (two replicates for each cell line) (as in Fig. S1) labeled with modified amino acids were incubated with protein-A beads for affinity pull-down (PD) assays. Precipitates were subjected for SILAC proteomic analysis. X and Y axes represent log2 ratios for Fc-Angptl3- vs. Fc-interacting individual proteins for replicates 1 and 2, respectively. C Scatter plot represents log2 ratio change of proteins specifically co-PDed with Fc-Angptl3. Each dot represents a single protein. D SmarcAL1 specifically interacts with Angptl3, but not with Angptl4 and Angptl8. Western analysis of the protein-A affinity precipitates from Fc, Fc-Angptl3, -Angptl4, and -Angptl8 cells with anti-SmarcAL1 (top and bottom) and HRP-conjugated anti-Fc (middle) antibodies. See Fig. S9 for full images of this panel.
Fig. 2
Fig. 2. Inactivation of SmarcAL1 gene in cells disrupts cellular lipid homeostasis and SmarcAL1 KO in mice drastically increases plasma triglyceride (TG) levels.
A, B Inactivation of SmarcAL1 gene in cells induces massive lipid droplet (LD) formation. Heterologous (A) and homologous (B) inactivation of SmarcAL1 genes in McA (A) and Huh7 (B) cells, respectively, induced LD formation captured under light microscopy (top). SmarcAL1 expression was confirmed with Western analysis (three replicates for each cell line) with anti-SmarcAL1 and -β-actin antibodies (bottom). C1 and C4 in A represent two McA clones with heterologous inactivation of SmarcAL1 gene. C Confirmation of SmarcAL1 heterozygous (HET) or homozygous (KO) gene deletion in mice. Western analysis of SmarcAL1 expression of liver extracts from the mice as indicated using anti-SmarcAL1 and -GAPDH antibodies. See Figs. S10–S12 for full images of the Western blots. D Metabolomic analysis of plasma from the WT and KO littermates (3 mice each). Ratios were calculated by comparing the averages of each metabolite of KO mice with those of WT mice and minus one. E, F Inactivation of SmarcAL1 gene increases plasma TG levels in mice. Plasma TG levels from individual littermates of the WT, HET, and KO mice with normal chow diet. Individual plasma samples were measured for TG using TG colorimetric assay kit (Cayman). Each dot represents a single mouse (E). Comparison of the plasma TG and total cholesterol (TC) profiles from the littermates of the WT, HET, and KO mice. Pooled plasma samples (from six mice each) from WT, HET and KO mice were fractionated by FPLC, and the fractions were analyzed for TG and TC separately. TG-rich lipoprotein (TRL), LDL and HDL in the fractions are indicated (F). P values calculated from t test and two-way ANOVA as indicated.
Fig. 3
Fig. 3. SMARCAL1 translocates from nucleus to cytoplasm and enriches on peroxisomes.
A Enrichment of SMARCAL1 on peroxisomes. Human primary hepatocytes were fixed and hybridized with anti-PMP70 (peroxisome marker, green) and -SmarcAL1 (red), and then with fluorescence-labeled secondary antibodies. Images were acquired with confocal microscopy. B Image quantification. Quantification was carried out from two independent experiments as in A. The averages and deviations were calculated from ~200 human hepatocytes. C Immunofluorescence analysis of SMARCAL1 distribution in SMARCAL1 KO and WT Huh7 cells. The cells were analyzed as in A. D Image quantification. Quantification of PMP70 and SMARCAL1 signals in cytoplasm and nucleus from the images as in C. Quantification was carried out from three independent experiments. The averages and deviations were calculated from three clones of the KO and control cells (>3000 cells for each). P values were calculated with t test as indicated.
Fig. 4
Fig. 4. Inactivation of SmarcAL1 gene decreases the expression of genes related to cellular lipid metabolism.
A Volcano plot for differential gene expression. Total RNA from SmarcAL1+/− and WT control McA cells (three replicates for each) was used in RNA-seq assays. Differentially expressed genes (FDR < 0.05) were included in the plot. B Pathway and biological process enrichment analyses based on the differentially expressed genes. C Differentially expressed genes related to lipid, FA, mitochondria, peroxisome metabolism and insulin resistance. The expression of LDL receptor (LDLR), LDLR-related protein (LRP)1, LRP4 and LRP5 genes is indicated with arrows (see Supplementary Data 3 for expression details).
Fig. 5
Fig. 5. SMARCAL1 tissue-specific expression and association analysis of the genetic variations at SMARCAL1 gene locus.
A SMARCAL1 tissue-specific RNA expression profile. The normalized RNA expression was adapted from a consensus dataset created from two independent sources, HPA (human protein atlas) and GTEx (genotype-tissue expression) RNA-seq data. nTPM, normalized transcript per million. B Genetic association analysis of the variants at the SMARCAL1 gene locus. Regional association plots of the variants with BMI (left) and total cholesterol (TC) (right). The p values and variant ID of the top variants (blue square) for each phenotype are indicated (see Figs. S6 and S7 and Supplementary Data 4–6 for the genetic association details). CE SMARCAL1 eQTL (expression quantitative trait loci) analysis and its effect on BMI. Two variants, rs284526 and rs284576, have opposite effects on SMARCAL1 expression from GTEx database (included the major organs and tissues) (C). Violin plots represent the effect of rs284526 and rs284576 eQTLs on SMARCAL1 expression in the representative tissue and organ as indicated (D). The effect on BMI of the two variants based on association studies of GIANT-UK Biobank GWAS Meta-analysis (E).

References

    1. Coleman MA, Eisen JA, Mohrenweiser HW. Cloning and characterization of HARP/SMARCAL1: a prokaryotic HepA-related SNF2 helicase protein from human and mouse. Genomics. 2000;65:274–282. doi: 10.1006/geno.2000.6174. - DOI - PubMed
    1. Ryan DP, Owen-Hughes T. Snf2-family proteins: chromatin remodellers for any occasion. Curr. Opin. Chem. Biol. 2011;15:649–656. doi: 10.1016/j.cbpa.2011.07.022. - DOI - PMC - PubMed
    1. Elizondo LI, et al. Schimke immuno-osseous dysplasia: a cell autonomous disorder? Am. J. Med. Genet. A. 2006;140:340–348. doi: 10.1002/ajmg.a.31089. - DOI - PubMed
    1. Boerkoel CF, et al. Mutant chromatin remodeling protein SMARCAL1 causes Schimke immuno-osseous dysplasia. Nat. Genet. 2002;30:215–220. doi: 10.1038/ng821. - DOI - PubMed
    1. Clewing JM, et al. Schimke immuno-osseous dysplasia: a clinicopathological correlation. J. Med. Genet. 2007;44:122–130. doi: 10.1136/jmg.2006.044313. - DOI - PMC - PubMed

Publication types

Supplementary concepts