. 2023 Dec 22;21(1):927.
doi: 10.1186/s12967-023-04774-4.

Circulating small extracellular vesicles microRNAs plus CA-125 for treatment stratification in advanced ovarian cancer

Affiliations

Circulating small extracellular vesicles microRNAs plus CA-125 for treatment stratification in advanced ovarian cancer

Xiaofang Zhou et al. J Transl Med. .

Abstract

Background: No residual disease (R0 resection) after debulking surgery is the most critical independent prognostic factor for advanced ovarian cancer (AOC). There is an unmet clinical need for selecting primary or interval debulking surgery in AOC patients using existing prediction models.

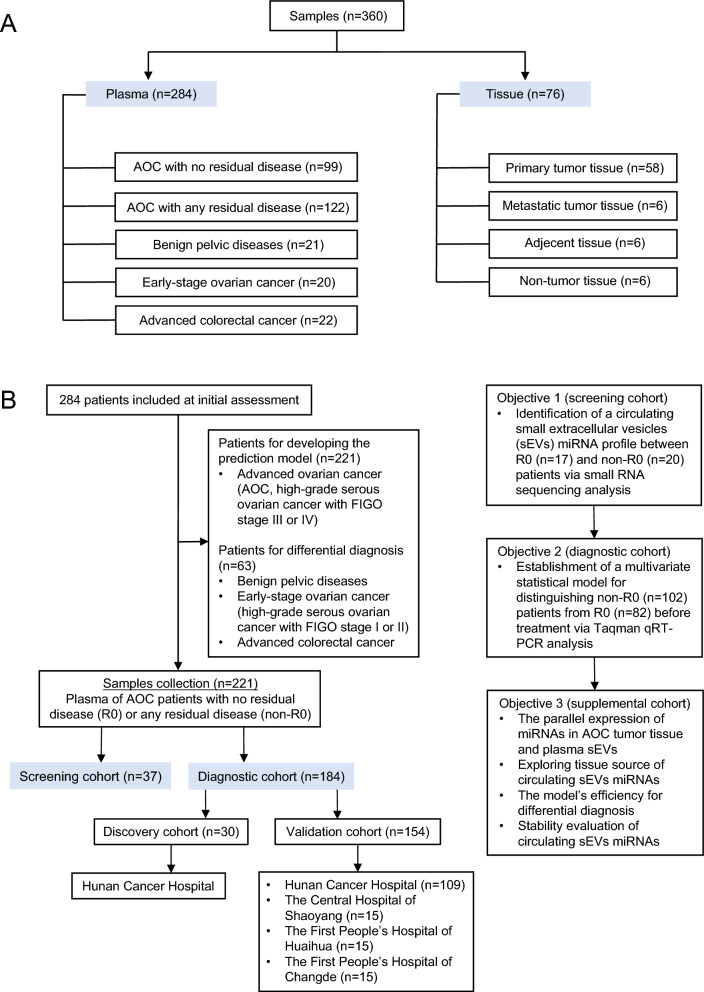
Methods: RNA sequencing of circulating small extracellular vesicles (sEVs) was used to discover the differential expression microRNAs (DEMs) profile between any residual disease (R0, n = 17) and no residual disease (non-R0, n = 20) in AOC patients. We further analyzed plasma samples of AOC patients collected before surgery or neoadjuvant chemotherapy via TaqMan qRT-PCR. The combined risk model of residual disease was developed by logistic regression analysis based on the discovery-validation sets.

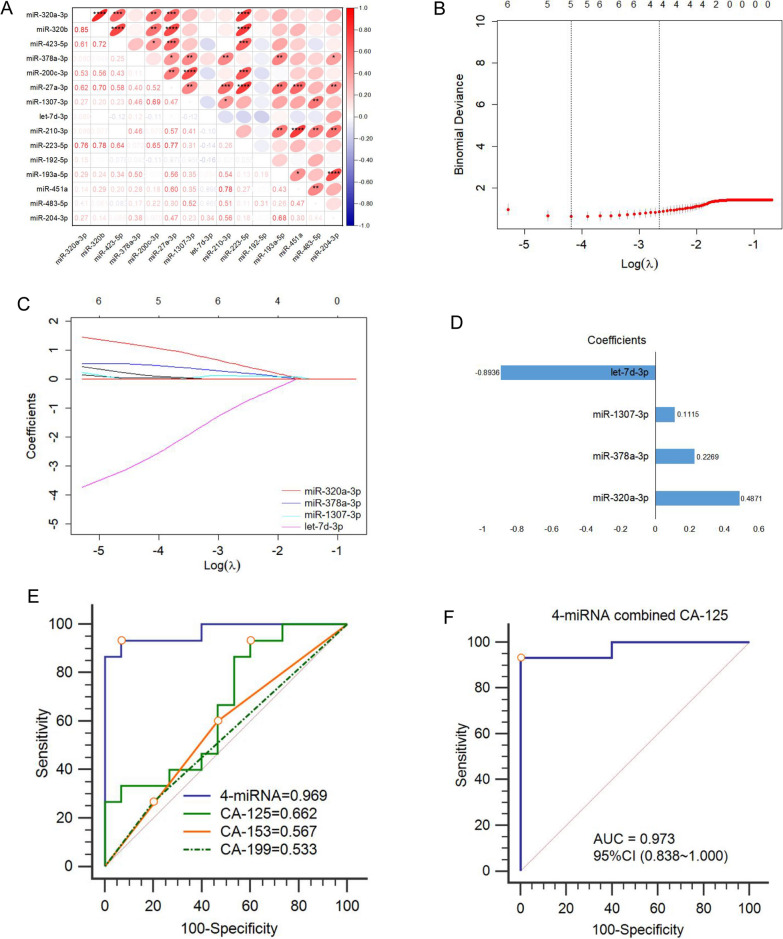
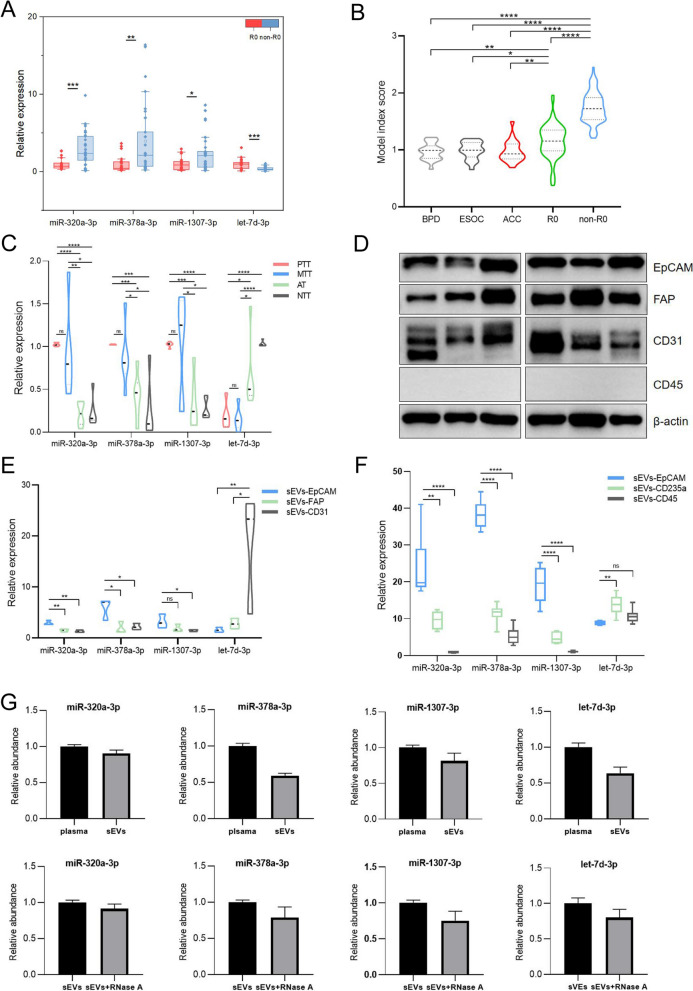
Results: Using a comprehensive plasma small extracellular vesicles (sEVs) microRNAs (miRNAs) profile in AOC, we identified and optimized a risk prediction model consisting of plasma sEVs-derived 4-miRNA and CA-125 with better performance in predicting R0 resection. Based on 360 clinical human samples, this model was constructed using least absolute shrinkage and selection operator (LASSO) and logistic regression analysis, and it has favorable calibration and discrimination ability (AUC:0.903; sensitivity:0.897; specificity:0.910; PPV:0.926; NPV:0.871). The quantitative evaluation of Net Reclassification Improvement (NRI) and Integrated Discrimination Improvement (IDI) suggested that the additional predictive power of the combined model was significantly improved contrasted with CA-125 or 4-miRNA alone (NRI = 0.471, IDI = 0.538, p < 0.001; NRI = 0.122, IDI = 0.185, p < 0.01).

Conclusion: Overall, we established a reliable, non-invasive, and objective detection method composed of circulating tumor-derived sEVs 4-miRNA plus CA-125 to preoperatively anticipate the high-risk AOC patients of residual disease to optimize clinical therapy.

Keywords: Ovarian cancer; Prediction model; Residual disease; Small extracellular vesicles; microRNA.


Conflict of interest statement

The authors declare that they have no competing interests.

Figures

Fig. 1
Fig. 1
Assay design and clinical characteristics A: A total of 360 plasma and tissue samples were tested in our study. B: Flowchart of study design was prepared to establish a diagnostic model for predicting residual disease risk in AOC patients. AOC advanced ovarian cancer
Fig. 2
Fig. 2
Characterization of large and small EVs isolated from AOC tissues. A: 10 micro-liters of large a and small vesicles b from AOC tissues were loaded onto grids, negative stained, and evaluated with transmission electron microscopy (TEM). Scale bars, 200 nm. B: Size distribution of large a and small vesicles b were obtained using nanoparticle tracking analysis (NTA; ZetaView®). Size distribution is presented as graphs with the concentration of the structures on the y-axis and the diameter of the structures in nanometres on the x-axis. C: RNA of large a and small vesicles b were isolated directly from the EV pellets and was analysed with a Bioanalyzer® (Agilent 2100). AOC advanced ovarian cancer
Fig. 3
Fig. 3
Plasma sEVs derived miRNA profile in AOC patients A: Volcano plot showed all DEMs between non-R0 (n = 20) and R0 (n = 17) groups in small RNA sequencing. The red and blue represented the up-regulated and down-regulated DEMs, respectively. (|log2(FC)|> 1, P < 0.05); The table summarized the numbers of DEMs defined by different P values. B: A heatmap of 51 DEMs expressions in miRNA-seq data. C: Principal component analysis of 51 DEMs expressions between non-R0 and R0 groups. miRNA microRNA, sEVs small extracellular vesicles, AOC advanced ovarian cancer, DEMs differentially expressed miRNAs, R0 advanced ovarian cancer with no residual disease, non-R0 advanced ovarian cancer with any residual disease
Fig. 4
Fig. 4
Construction of a prediction model using plasma sEVs derived miRNAs and CA-125 in the discovery set A: Pearson correlation analysis of 15 selected miRNAs levels detected by Taqman qRT-PCR in the discovery set (R0, n = 15; non-R0, n = 15). Pearson correlation coefficient and P value were displayed in the bottom-left and the upper-right, respectively. B: The log(λ) was plotted versus AUC. Numbers along the upper x-axis indicated the number of predicted factors. The black vertical lines defined the optimal values of λ (λ = 0.07), where the model provided the best fitting to the data; C: The LASSO coefficient profile plot of the selected 4 texture features (miR-320a-3p, miR-378a-3p, miR-1307-3p, let-7d-3p). D: The LASSO coefficient values of 4 miRNAs. E–F: The ROC curves of (E) 4-miRNA panel, CA-125, CA-153, CA-199, and F 4-miRNA combined with CA-125 for detecting residual disease in the discovery set. Maximum classification accuracy was labeled by the red circle. miRNA microRNA, sEVs small extracellular vesicles, R0 advanced ovarian cancer with no residual disease, non-R0 advanced ovarian cancer with any residual disease, LASSO least absolute shrinkage and selection operator, AUC area under the receiver operating characteristic curve, ROC receiver operating characteristic curve; *P < 0.05; ** < 0.01; *** < 0.001; **** < 0.0001
Fig. 5
Fig. 5
Combining 4-miRNA with CA-125 for R0 and non-R0 patients categorization in the validation set AB: The ROC curves of A 4-miRNA panel, CA-125, CA-153, CA-199, and B 4-miRNA combined with CA-125 for detecting residual disease in the validation set (R0, n = 67; non-R0, n = 87). Maximum classification accuracy was labeled by the red circle. C: The 2-dimensional classified plot of the 4-miRNA panel score (y-axis) and serum log10(CA-125) level (x-axis) for all subjects in the discovery and validation sets (n = 184). The horizontal and vertical dashed lines represented the classification threshold of the 4-miRNA panel (1.422) and CA-125 (600 U/ml), respectively. The misclassified cases via 4-miRNA panel or CA-125 were marked with a red point (n = 27) or a blue circle (n = 59), respectively. D: The 2-dimensional classified plot of the prediction model combining 4-miRNA with CA-125 for all subjects in the discovery and validation sets (n = 184). The horizontal dashed line was the classification threshold (1.483) of the combined model. The false-positive and false-negative cases were in red (n = 16). E: The decision curve analysis (DCA) plot of three models (CA-125, 4-miRNA, 4-miRNA combined with CA-125) (n = 184). F: The P value list of differentially expressed 4-miRNA in our panel and public datasets(GSE113486, GSE94533). Red marked up-regulated miRNAs and blue marked down-regulated miRNAs. miRNA. microRNA; ROC receiver operating characteristic curve, R0, advanced ovarian cancer with no residual disease, non-R0 advanced ovarian cancer with any residual disease; *P < 0.05; ** < 0.01; *** < 0.001; **** < 0.0001
Fig. 6
Fig. 6
Tumor cells-derived sEVs miRNAs contribute to plasma sEVs miRNAs signature in AOC patients A: The 4-miRNA expressions in tumor tissue between two groups were verified by Taqman qRT-PCR (R0, n = 20; non-R0, n = 30). B: The 4-miRNA expressions in sEVs derived from primary tumor tissue (PTT, n = 6), metastatic tumor tissue (MTT, n = 6), adjacent tissue (AT, n = 6), or non-tumor tissue (NTT, n = 6) via Taqman qRT-PCR. C: Representative western blots of cell-type-specific protein in primary tumor tissue sEVs (n = 6); D: Taqman qRT-PCR analysis of 4-miRNA in different cell-source sEVs separated from primary tumor tissue (n = 3); E: Taqman qRT-PCR analysis of 4-miRNA in plasma different cell-source sEVs captured by magnetic beads sorting system (n = 6); EpCAM was chosen as epithelial ovarian cancer cells marker; FAP as cancer-associated fibroblasts marker; CD31 as endothelial cells marker; CD45 as tumor-infiltrating immune cells and leukocytes marker; CD235a as erythrocytes marker. F: The comparison of model index score between R0 (n = 82) or non-R0 (n = 102) patients and benign pelvic diseases (BPD, n = 21), early-stage ovarian cancer with FIGO I or II (ESOC, n = 20), and advanced colorectal cancer patients (ACC, n = 22). G: The relative expression levels of miR-320a-3p, miR-378a-3p, miR-1307-3p, let-7d-3p were detected from total plasma, plasma sEVs, and plasma sEVs pretreating with RNase A. miRNA, microRNA; R0, advanced ovarian cancer with no residual disease; non-R0, advanced ovarian cancer with any residual disease; sEVs, small extracellular vesicles; AOC, advanced ovarian cancer; *P < 0.05; ** < 0.01; *** < 0.001; **** < 0.0001 (unpaired t-test)
Fig. 7
Fig. 7
Target genes prediction and pathway enrichment analysis of the multi-miRNA panel A: Upset plot of 4-miRNA’s target genes via Targetscan, miRWalk, and Tothill dataset. B: Expression heatmap of representative 4-miRNA related target genes between R0 (n = 38) and non-R0 (n = 127) groups in the Tothill dataset. Orange represented up-regulated target genes, and yellow represented down-regulated target genes. C: GO enrichment analysis of target genes was performed and visualized by GOplot. Log(FC) of selected genes was taken from Tothill dataset. Z-score indicated if the biological process (biological process/cellular components/molecular function) was more likely to be increased (Z-score > 0) or decreased (Z-score < 0). The area of the circles was proportional to the number of genes in the pathway. A threshold was set as log(adj P value) > 2. D: A bubble plot of enriched KEGG pathway. E: GSEA was performed by the expression of 4-miRNA target genes between R0 and non-R0 groups in Tothill dataset. miRNA microRNA, R0 advanced ovarian cancer with no residual disease; non-R0 advanced ovarian cancer with any residual disease; KEGG Kyoto Encyclopedia of genes and Genomes

References

    1. Siegel RL, Miller KD, Fuchs HE, Jemal A. Cancer statistics. CA Cancer J Clin. 2021;71:7–33. doi: 10.3322/caac.21654. - DOI - PubMed
    1. Horowitz NS, Miller A, Rungruang B, Richard SD, Rodriguez N, Bookman MA, Hamilton CA, Krivak TC, Maxwell GL. Does aggressive surgery improve outcomes? Interaction between preoperative disease burden and complex surgery in patients with advanced-stage ovarian cancer: an analysis of gog 182. J Clin Oncol. 2015;33:937–943. doi: 10.1200/JCO.2014.56.3106. - DOI - PMC - PubMed
    1. William EWI, Maxwell GL, Tian C, Sundborg MJ, Rose GS, Rose PG, Rubin SC, Muggia F, Mcguire WP, Gynecologic OG. Tumor residual after surgical cytoreduction in prediction of clinical outcome in stage iv epithelial ovarian cancer: a gynecologic oncology group study. J Clin Oncol. 2008;26:83–89. doi: 10.1200/JCO.2007.13.1953. - DOI - PubMed
    1. Vergote I, Coens C, Nankivell M, Kristensen GB, Parmar M, Ehlen T, Jayson GC, Johnson N, Swart AM, Verheijen R, Mccluggage WG, Perren T, Panici PB, Kenter G, Casado A, Mendiola C, Stuart G, Reed NS, Kehoe S. Neoadjuvant chemotherapy versus debulking surgery in advanced tubo-ovarian cancers: pooled analysis of individual patient data from the eortc 55971 and chorus trials. Lancet Oncol. 2018;19:1680–1687. doi: 10.1016/S1470-2045(18)30566-7. - DOI - PubMed
    1. Suidan RS, Ramirez PT, Sarasohn DM, Teitcher JB, Iyer RB, Zhou Q, Iasonos A, Denesopolis J, Zivanovic O, Long Roche KC, Sonoda Y, Coleman RL, Abu-Rustum NR, Hricak H, Chi DS. A multicenter assessment of the ability of preoperative computed tomography scan and ca-125 to predict gross residual disease at primary debulking for advanced epithelial ovarian cancer. Gynecol Oncol. 2017;145:27–31. doi: 10.1016/j.ygyno.2017.02.020. - DOI - PMC - PubMed

Publication types