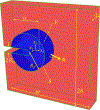
Cracks in tensile-contracting and tensile-dilating poroelastic materials
- PMID: 38130319
- PMCID: PMC10732463
- DOI: 10.1016/j.ijsolstr.2023.112563
Cracks in tensile-contracting and tensile-dilating poroelastic materials
Abstract
Fibrous gels such as cartilage, blood clots, and carbon-nanotube-based sponges with absorbed oils suffer a reduction in volume by the expulsion of liquid under uniaxial tension, and this directly affects crack-tip fields and energy release rates. A continuum model is formulated for isotropic fibrous gels that exhibit a range of behaviors from volume increasing to volume decreasing in uniaxial tension by changing the ratio of two material parameters. The motion of liquid in the pores of such gels is modeled using poroelasticity. The direction of liquid fluxes around cracks is shown to depend on whether the gel locally increases or decreases in volume. The energy release rate for cracks is computed using a surface-independent integral and it is shown to have two contributions - one from the stresses in the solid network, and another from the flow of liquid. The contribution to the integral from liquid permeation tends to be negative when the gel exhibits volume decrease, which effectively is a crack shielding mechanism.
Keywords: Biomaterials; Crack shielding; Energy release rate; Fracture; Liquid permeation; Path-independent integral; Poroelastic Toughening; Tensile contracting hydrogels.
Conflict of interest statement
Declaration of interests The authors declare that they have no known competing financial interests or personal relationships that could have appeared to influence the work reported in this paper. 8.Declaration of competing interests The authors declare no competing interest.
Figures


Similar articles
-
Conceptual fracture parameters for articular cartilage.Clin Biomech (Bristol). 2007 Jul;22(6):725-35. doi: 10.1016/j.clinbiomech.2007.03.005. Epub 2007 May 9. Clin Biomech (Bristol). 2007. PMID: 17493717
-
Analysis of Micro-Evolution Mechanism of 3D Crack Initiation in Brittle Materials with Hole under Uniaxial Compression.Materials (Basel). 2024 Feb 16;17(4):920. doi: 10.3390/ma17040920. Materials (Basel). 2024. PMID: 38399171 Free PMC article.
-
The energy release rate for non-penetrating crack in poroelastic body by fluid-driven fracture.Math Mech Solids. 2023 Feb;28(2):592-610. doi: 10.1177/10812865221086547. Epub 2022 Apr 20. Math Mech Solids. 2023. PMID: 36743389 Free PMC article.
-
Descriptions of crack growth behaviors in glass-ZrO2 bilayers under thermal residual stresses.Dent Mater. 2016 Sep;32(9):1165-76. doi: 10.1016/j.dental.2016.06.019. Epub 2016 Jul 15. Dent Mater. 2016. PMID: 27424270
-
Mixed-mode stress intensity factors for kink cracks with finite kink length loaded in tension and bending: application to dentin and enamel.J Mech Behav Biomed Mater. 2010 May;3(4):303-12. doi: 10.1016/j.jmbbm.2009.12.004. Epub 2010 Jan 11. J Mech Behav Biomed Mater. 2010. PMID: 20346898
Cited by
-
Poroelasticity and permeability of fibrous polymer networks under compression.Soft Matter. 2025 Mar 26;21(13):2400-2412. doi: 10.1039/d4sm01223b. Soft Matter. 2025. PMID: 39976571 Free PMC article.
References
-
- Baumberger T, Caroli C, and Martina D. (2006). Solvent control of crack dynamics in a reversible hydrogel. Nature Materials, 5:552–555. - PubMed
-
- Bischoff JE, Arruda EM, and Grosh K. (2001). A New Constitutive Model for the Compressibility of Elastomers at Finite Deformations. Rubber Chemistry and Technology, 74(4):541–559.
-
- Bleiler C. and Röhrle O. (2022). Strain measures and energies for crimped fibres and novel analytical expressions for fibre populations: Ingredients for structural fibre network models. Journal of Elasticity, 150.
-
- Bouklas N, Landis CM, and Huang R. (2015). Effect of Solvent Diffusion on Crack-Tip Fields and Driving Force for Fracture of Hydrogels. Journal of Applied Mechanics, 82(8). 081007.
Grants and funding
LinkOut - more resources
Full Text Sources
