

Multi-domain feature joint optimization based on multi-view learning for improving the EEG decoding
- PMID: 38130433
- PMCID: PMC10733485
- DOI: 10.3389/fnhum.2023.1292428
Multi-domain feature joint optimization based on multi-view learning for improving the EEG decoding
Abstract
Background: Brain-computer interface (BCI) systems based on motor imagery (MI) have been widely used in neurorehabilitation. Feature extraction applied by the common spatial pattern (CSP) is very popular in MI classification. The effectiveness of CSP is highly affected by the frequency band and time window of electroencephalogram (EEG) segments and channels selected.
Objective: In this study, the multi-domain feature joint optimization (MDFJO) based on the multi-view learning method is proposed, which aims to select the discriminative features enhancing the classification performance.
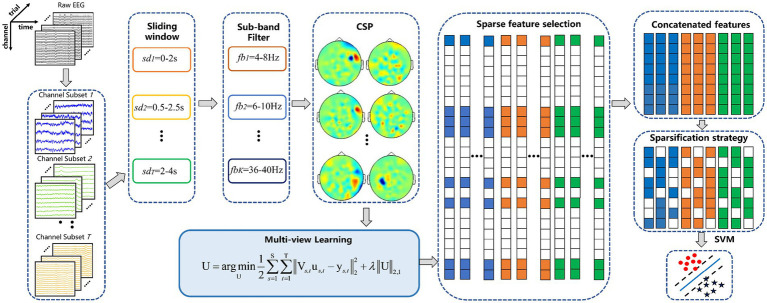
Method: The channel patterns are divided using the Fisher discriminant criterion (FDC). Furthermore, the raw EEG is intercepted for multiple sub-bands and time interval signals. The high-dimensional features are constructed by extracting features from CSP on each EEG segment. Specifically, the multi-view learning method is used to select the optimal features, and the proposed feature sparsification strategy on the time level is proposed to further refine the optimal features.
Results: Two public EEG datasets are employed to validate the proposed MDFJO method. The average classification accuracy of the MDFJO in Data 1 and Data 2 is 88.29 and 87.21%, respectively. The classification result of MDFJO was significantly better than MSO (p < 0.05), FBCSP32 (p < 0.01), and other competing methods (p < 0.001).
Conclusion: Compared with the CSP, sparse filter band common spatial pattern (SFBCSP), and filter bank common spatial pattern (FBCSP) methods with channel numbers 16, 32 and all channels as well as MSO, the MDFJO significantly improves the test accuracy. The feature sparsification strategy proposed in this article can effectively enhance classification accuracy. The proposed method could improve the practicability and effectiveness of the BCI system.
Keywords: brain-computer interface; common spatial pattern; electroencephalogram; motor imagery; multi-domain feature joint optimization.
Copyright © 2023 Shi, Yue, Yin, Zhao and Wang.
Conflict of interest statement
The authors declare that the research was conducted in the absence of any commercial or financial relationships that could be construed as a potential conflict of interest.
Figures


Similar articles
-
Improved motor imagery classification using adaptive spatial filters based on particle swarm optimization algorithm.Front Neurosci. 2023 Dec 13;17:1303648. doi: 10.3389/fnins.2023.1303648. eCollection 2023. Front Neurosci. 2023. PMID: 38192510 Free PMC article.
-
Optimizing spatial patterns with sparse filter bands for motor-imagery based brain-computer interface.J Neurosci Methods. 2015 Nov 30;255:85-91. doi: 10.1016/j.jneumeth.2015.08.004. Epub 2015 Aug 13. J Neurosci Methods. 2015. PMID: 26277421
-
The CSP-Based New Features Plus Non-Convex Log Sparse Feature Selection for Motor Imagery EEG Classification.Sensors (Basel). 2020 Aug 22;20(17):4749. doi: 10.3390/s20174749. Sensors (Basel). 2020. PMID: 32842635 Free PMC article.
-
Temporally Constrained Sparse Group Spatial Patterns for Motor Imagery BCI.IEEE Trans Cybern. 2019 Sep;49(9):3322-3332. doi: 10.1109/TCYB.2018.2841847. Epub 2018 Jun 14. IEEE Trans Cybern. 2019. PMID: 29994667
-
Formulation of the Challenges in Brain-Computer Interfaces as Optimization Problems-A Review.Front Neurosci. 2021 Jan 21;14:546656. doi: 10.3389/fnins.2020.546656. eCollection 2020. Front Neurosci. 2021. PMID: 33551716 Free PMC article. Review.
References
-
- Ang K. K., Chin Z. Y., Zhang H., Guan C. (2008). “Filter bank common spatial pattern (FBCSP) in brain-computer interface” in 2008 IEEE International Joint Conference on Neural Networks (IEEE World Congress on Computational Intelligence) (Hong Kong: IEEE; ), 2390–2397.
-
- Baig M. Z., Aslam N., Shum H. P., Zhang L. (2017). Differential evolution algorithm as a tool for optimal feature subset selection in motor imagery EEG. Expert Syst. Appl. 90, 184–195. doi: 10.1016/j.eswa.2017.07.033 - DOI
LinkOut - more resources
Full Text Sources