. 2023 Dec;13(12):e1513.
doi: 10.1002/ctm2.1513.

Molecular analysis of XPO1 inhibitor and gemcitabine-nab-paclitaxel combination in KPC pancreatic cancer mouse model

Affiliations

Molecular analysis of XPO1 inhibitor and gemcitabine-nab-paclitaxel combination in KPC pancreatic cancer mouse model

Md Hafiz Uddin et al. Clin Transl Med. 2023 Dec.

Abstract

Background: The majority of pancreatic ductal adenocarcinoma (PDAC) patients experience disease progression while on treatment with gemcitabine and nanoparticle albumin-bound (nab)-paclitaxel (GemPac) necessitating the need for a more effective treatment strategy for this refractory disease. Previously, we have demonstrated that nuclear exporter protein exportin 1 (XPO1) is a valid therapeutic target in PDAC, and the selective inhibitor of nuclear export selinexor (Sel) synergistically enhances the efficacy of GemPac in pancreatic cancer cells, spheroids and patient-derived tumours, and had promising activity in a phase I study.

Methods: Here, we investigated the impact of selinexor-gemcitabine-nab-paclitaxel (Sel-GemPac) combination on LSL-KrasG12D/+ ; LSL-Trp53R172H/+ ; Pdx1-Cre (KPC) mouse model utilising digital spatial profiling (DSP) and single nuclear RNA sequencing (snRNAseq).

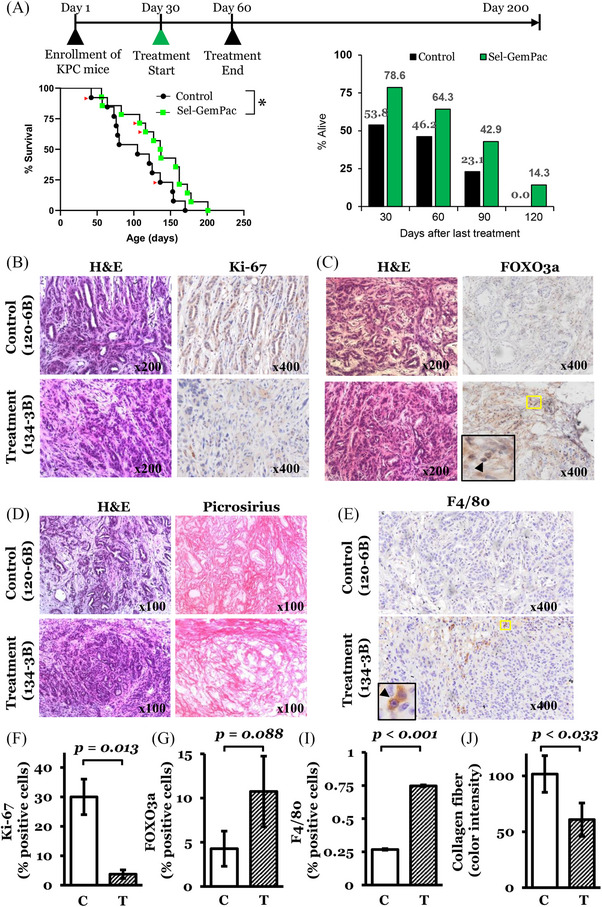
Results: Sel-GemPac synergistically inhibited the growth of the KPC tumour-derived cell line. The Sel-GemPac combination reduced the 2D colony formation and 3D spheroid formation. In the KPC mouse model, at a sub-maximum tolerated dose (sub-MTD) , Sel-GemPac enhanced the survival of treated mice compared to controls (p < .05). Immunohistochemical analysis of residual KPC tumours showed re-organisation of tumour stromal architecture, suppression of proliferation and nuclear retention of tumour suppressors, such as Forkhead Box O3a (FOXO3a). DSP revealed the downregulation of tumour promoting genes such as chitinase-like protein 3 (CHIL3/CHI3L3/YM1) and multiple pathways including phosphatidylinositol 3'-kinase-Akt (PI3K-AKT) signalling. The snRNAseq demonstrated a significant loss of cellular clusters in the Sel-GemPac-treated mice tumours including the CD44+ stem cell population.

Conclusion: Taken together, these results demonstrate that the Sel-GemPac treatment caused broad perturbation of PDAC-supporting signalling networks in the KPC mouse model.

Highlights: The majority of pancreatic ductal adenocarcinoma (PDAC) patients experience disease progression while on treatment with gemcitabine and nanoparticle albumin-bound (nab)-paclitaxel (GemPac). Exporter protein exportin 1 (XPO1) inhibitor selinexor (Sel) with GemPac synergistically inhibited the growth of LSL-KrasG12D/+; LSL-Trp53R172H/+; Pdx1-Cre (KPC) mouse derived cell line and enhanced the survival of mice. Digital spatial profiling shows that Sel-GemPac causes broad perturbation of PDAC-supporting signalling in the KPC model.

Keywords: KPC mouse model; digital spatial profiling; gemcitabine; nab-paclitaxel; pancreatic cancer; selinexor; snRNAseq.


Conflict of interest statement

Asfar S. Azmi is a council member at GLG and Guidepoint. Yosef Landesman was an employee of Karyopharm Therapeutics Inc. All other authors declare they have no conflicts of interest.

Figures

FIGURE 1
FIGURE 1
Effect of selinexor–gemcitabine–nab‐paclitaxel (Sel‐GemPac) combination in LSL‐KrasG12D/+; LSL‐Trp53R172H/+; Pdx1‐Cre (KPC) tumour‐derived KCI‐313 cell line. (A–E) Growth inhibition of KCI‐313 cells after gemcitabine (Gem), paclitaxel (Pac), selinexor (Sel) and combination treatments determined by 3‐(4,5‐dimethylthiazol‐2‐yl)−2,5‐diphenyltetrazolium bromide (MTT) assay. Dimethyl sulphoxide (DMSO) or drug combination treatments were done for 72 h. (A–C) The log10 dose–response curves with determined IC50 values for Gem, Pac and Sel. (D) The log10 dose–response curves with determined IC50 values for Gem when treated with Pac. (E) The combination of gemcitabine–nab‐paclitaxel (GemPac) and Sel with three different doses. All the doses are shown in nM concentrations. Combination treatments were compared to GemPac or Sel only using Student's t‐test. (F) Normalised isobologram for Gem, Pac and Sel combination treatments were generated using Calcusyn 2.0 software. (G) Colonies from KCI‐313 cells treated with indicated doses of Gem, Pac, Sel and their combinations. After 72 h cells were maintained in drug free media for ten additional days. Colonies were fixed and stained with .5% crystal violet solution containing methanol. (H) Three‐dimensional spheroid formation assay. KCI‐313 cells were seeded in an ultra‐low attachment plate with serum reduced media supplemented with growth factors. After a week of treatment, spheroids were imaged and analysed for their area using NIH ImageJ software (I). * p < .05; ** p < .01; *** p < .001.
FIGURE 2
FIGURE 2
Survival and immunohistochemical analysis of selinexor–gemcitabine–nab‐paclitaxel (Sel‐GemPac)‐treated LSL‐KrasG12D/+; LSL‐Trp53R172H/+; Pdx1‐Cre (KPC) mice tumours. (A) Top: Treatment plan. Left: Kaplan–Meier survival plot for control (n = 13) and Sel‐GemPac (n = 14)‐treated KPC mice. Selinexor (Sel) was given at a dose of 15 mg/kg orally (2×/week ×4). Gemcitabine (Gem) and paclitaxel (Pac) were given at a dose of 30 mg/kg i.v. twice a week for 2 weeks. Red arrow heads indicate the mice used for further analysis. Right: Percentage of survived mice at different time points after last treatment in control and Sel‐GemPac groups. (B and C) Immunohistochemical staining of Ki‐67 and Forkhead Box O3a (FOXO3a) in representative control (120‐6B) and treated (134‐3B) tumour tissues, respectively. Nuclear accumulation of FOXO3a is enlarged and marked with arrowhead (lower panel). (D) Picrosirius staining performed on representative control (120‐6B) and treated (134‐3B) tumour tissues. Corresponding haematoxylin and eosin (H&E) staining is shown in the left panel. Original magnifications are shown on each histopathological image. (E) F4/80 immunohistochemical staining. (F–I) Percentage of Ki‐67, FOXO3a and F4/80‐positive cells in the tissue samples. (J) Abundance of collagen fibre measured as colour intensity by NIH ImageJ software. C, control; T, Sel‐GemPac treated. * p < .05.
FIGURE 3
FIGURE 3
Digital spatial transcriptomics (DSP) analysis of control and treated LSL‐KrasG12D/+; LSL‐Trp53R172H/+; Pdx1‐Cre (KPC) mice tumours. (A) Selected three region of interests (ROIs) from treated and control KPC mice tumours containing more than 50 cells. For the selection of specific cell types, circle, rectangle or irregular shapes were drawn around the regions. Morphology markers mouse pan‐cytokeratin (panCK, green) and CD45 (yellow) were used to distinguish cancer cells and immune cells . DNA was stained with SYTO83 dye (blue). ROIs were selected in triplicates based on haematoxylin and eosin (H&E) staining and morphology markers. (B) Differentially expressed genes (DEGs) between treated and untreated KPC mice tumour sections. The dotted lines are used to select the DEGs. Significantly (p < .05) overexpressed genes are shown in red and under‐expressed genes are shown in blue. (C) Top impacted pathways in the treated tumours compared to control tumours. The x‐axis indicated over‐representation (pORA) and the y‐axis indicated total pathway accumulation (pAcc). Each dot represents a pathway and the dot size is proportional to the represented pathway. Significant and non‐significant pathways are shown in red and grey, respectively. (D and E) Impacted genes and pathways associated with cell adhesion molecules and phosphatidylinositol 3'‐kinase‐Akt (PI3K‐AKT signalling pathway). The genes that show differential expression are arranged according to their log fold‐change (FC). Genes that have been upregulated are visualised in red, while genes that have been downregulated are represented in blue. On the top, the box and whisker plot provide a summary of the distribution of all genes. The box in the plot depicts the first quartile, median and third quartile of the distribution, whereas any outliers in the data are depicted as circles. Each gene's computed perturbation is overlaid on the pathway diagram (text colour). The perturbation considered both the measured FC of each gene and the accumulated perturbation propagated from any upstream genes, accounting for the cumulative effect on downstream genes. The highest negative and positive perturbations are shown in dark blue and dark red, respectively.
FIGURE 4
FIGURE 4
Gene Ontology (GO) analysis of control and treated LSL‐KrasG12D/+; LSL‐Trp53R172H/+; Pdx1‐Cre (KPC) mice tumours. (A) The top identified biological processes, cellular processes and molecular functions. The number of genes that are differentially expressed and associated with a particular GO term is compared to the expected number of differentially expressed genes (DEGs) for that term just by chance. An over‐representation approach (pORA) is used by iPathwayGuide to compute the statistical significance of observing at least the given number of DEGs. The hypergeometric distribution is utilised to calculate the p‐value, which is then adjusted for multiple comparisons using false discovery rate (FDR). (B) Gene measured expression bar plots. Gene expression analysis of cancer tissues performed between selinexor–gemcitabine–nab‐paclitaxel (Sel‐GemPac)‐treated KPC mice compared to untreated KPC mice. All the DEGs involved in regulation of cell population proliferation, extracellular space and extracellular matrix binding are ranked based on their absolute value of log fold‐change (FC). A total of 50, 52 and eight genes are differentially expressed out of 1183, 859 and 49 genes, respectively. All the DEGs that are annotated to extracellular space are ranked based on their absolute value of log FC. The top genes are shown. Upregulated genes are shown in red, and downregulated genes are shown in blue. The box and whisker plot on the left summarises the distribution of all the DEGs that are annotated to this GO term. (C) Ancestor charts for top identified biological processes, cellular components and molecular functions impacted by Sel‐GemPac treatment in KPC mice. The regulation of cell population proliferation regulates biological processes via cellular process and biological regulation. Extracellular space acts via the cellular anatomical entity. The extracellular matrix binding directly modulates molecular functions.
FIGURE 5
FIGURE 5
Digital spatial proteomic analysis of control and treated LSL‐KrasG12D/+; LSL‐Trp53R172H/+; Pdx1‐Cre (KPC) mice tumours. Processing of KPC mice tumour tissue sections for digital spatial profiling (DSP) analysis utilising GeoMx nanostring platform. Region of interests (ROIs, right panel) was selected in triplicates based on haematoxylin and eosin (H&E) staining and morphology markers. Complimentary photocleavable antibody‐oligo sequences were utilised for sequencing and detection. (A) Selected three ROIs from treated and control KPC mice tumours containing more than 50 cells. (B) Selected three ROIs from treated and control KPC mice stroma containing more than 50 cells. For the selection of specific cell types, circle, rectangle or irregular shapes were drawn around the regions. (C) The signal (log2) to background ratio plot for each protein target. Negative controls (IgGs) (green) are plotted on the far left of the plot. All the protein targets are above the baseline except green fluorescent protein (GFP) and androgen receptor (AR), which are close to the baseline. All these proteins were analysed for differential expression comparisons. (D) Volcano plot for the expressed proteins in treated KPC tumour cells compared to control KPC tumour cells. (E) Volcano plot for the expressed proteins in treated KPC stromal cells compared to control KPC stromal cells. In volcano plots, unadjusted p‐value of .05 and fold‐change (FC) of 1.5 were used to identify differentially expressed proteins. Non‐significant proteins, proteins with FC ≥1.5, proteins with p‐value <.05, and significant proteins are shown in grey, green, blue and red dots.
FIGURE 6
FIGURE 6
Two‐dimensional t‐distributed stochastic neighbour embedding (t‐SNE) combined analysis of single nuclear RNA sequences from untreated (control) and treated LSL‐KrasG12D/+; LSL‐Trp53R172H/+; Pdx1‐Cre (KPC) tumour cells. (A) Two‐dimensional t‐SNE analysis of single nuclear RNA sequences from representative control (120‐6B) and treated (134‐3B) KPC mice tumour cells. Different clusters of cells are colour‐coded. (B) (i) Merged clusters of control and treated KPC tumour cells. All clusters of control are in brown colour, whereas all clusters of treatment are in blue colour. Expression of GM42418 (ii), CAMK1D (iii) and MALAT1 (iv) among the clusters. Dark red indicates higher expression of transcript targets and colour key is shown below of each target.
FIGURE 7
FIGURE 7
Validation of transcriptomic finding using immunohistochemical staining, quantitative polymerase chain reaction (qPCR) and immunoblot analysis. (A) Immunohistochemical staining of CHIL3 in representative control (120‐6B) and treated (134‐3B) tumour tissues, respectively. Corresponding haematoxylin and eosin (H&E) staining is shown in the left panel. (B) Percentage of CHIL3‐positive cells in the tissue samples. C, control; T, Sel‐GemPac treated. Original magnifications are shown on each histopathological image. (C‐D) Validation of expression of top differentially expressed genes in LSL‐KrasG12D/+; LSL‐Trp53R172H/+; Pdx1‐Cre (KPC) tumour‐derived KCI‐313 cell line using real‐time qPCR and immunoblot analysis. Cells were treated with gemcitabine (Gem) (20 nM), paclitaxel (Pac) (15 nM) and selinexor (Sel) (400 nM) for 24 h or 72 h. Sel‐GemPac, selinexor–gemcitabine–nab‐paclitaxel.

References

    1. Malvezzi M, Bertuccio P, Levi F, La Vecchia C, Negri E. European cancer mortality predictions for the year 2014. Ann Oncol. 2014;25(8):1650‐1656. - PubMed
    1. Siegel RL, Miller KD, Jemal A. Cancer statistics, 2019. CA Cancer J Clin. 2019;69(1):7‐34. - PubMed
    1. Corrie PG, Qian W, Basu B, et al. Scheduling nab‐paclitaxel combined with gemcitabine as first‐line treatment for metastatic pancreatic adenocarcinoma. Br J Cancer. 2020;122(12):1760‐1768. - PMC - PubMed
    1. Von Hoff DD, Ervin T, Arena FP, et al. Increased survival in pancreatic cancer with nab‐paclitaxel plus gemcitabine. N Engl J Med. 2013;369(18):1691‐1703. - PMC - PubMed
    1. Von Hoff DD, Goldstein D, Renschler MF. Albumin‐bound paclitaxel plus gemcitabine in pancreatic cancer. N Engl J Med. 2014;370(5):479‐480. - PubMed

Publication types

MeSH terms