

The temporal structure of goal-directed and habitual operant behavior
- PMID: 38131488
- PMCID: PMC10872308
- DOI: 10.1002/jeab.896
The temporal structure of goal-directed and habitual operant behavior
Abstract
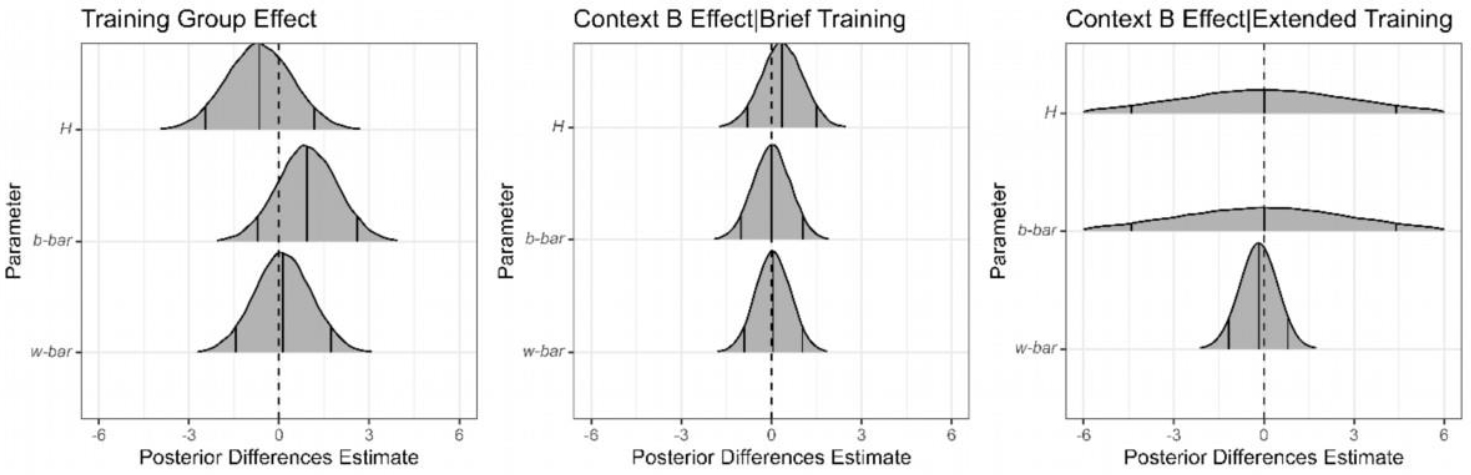
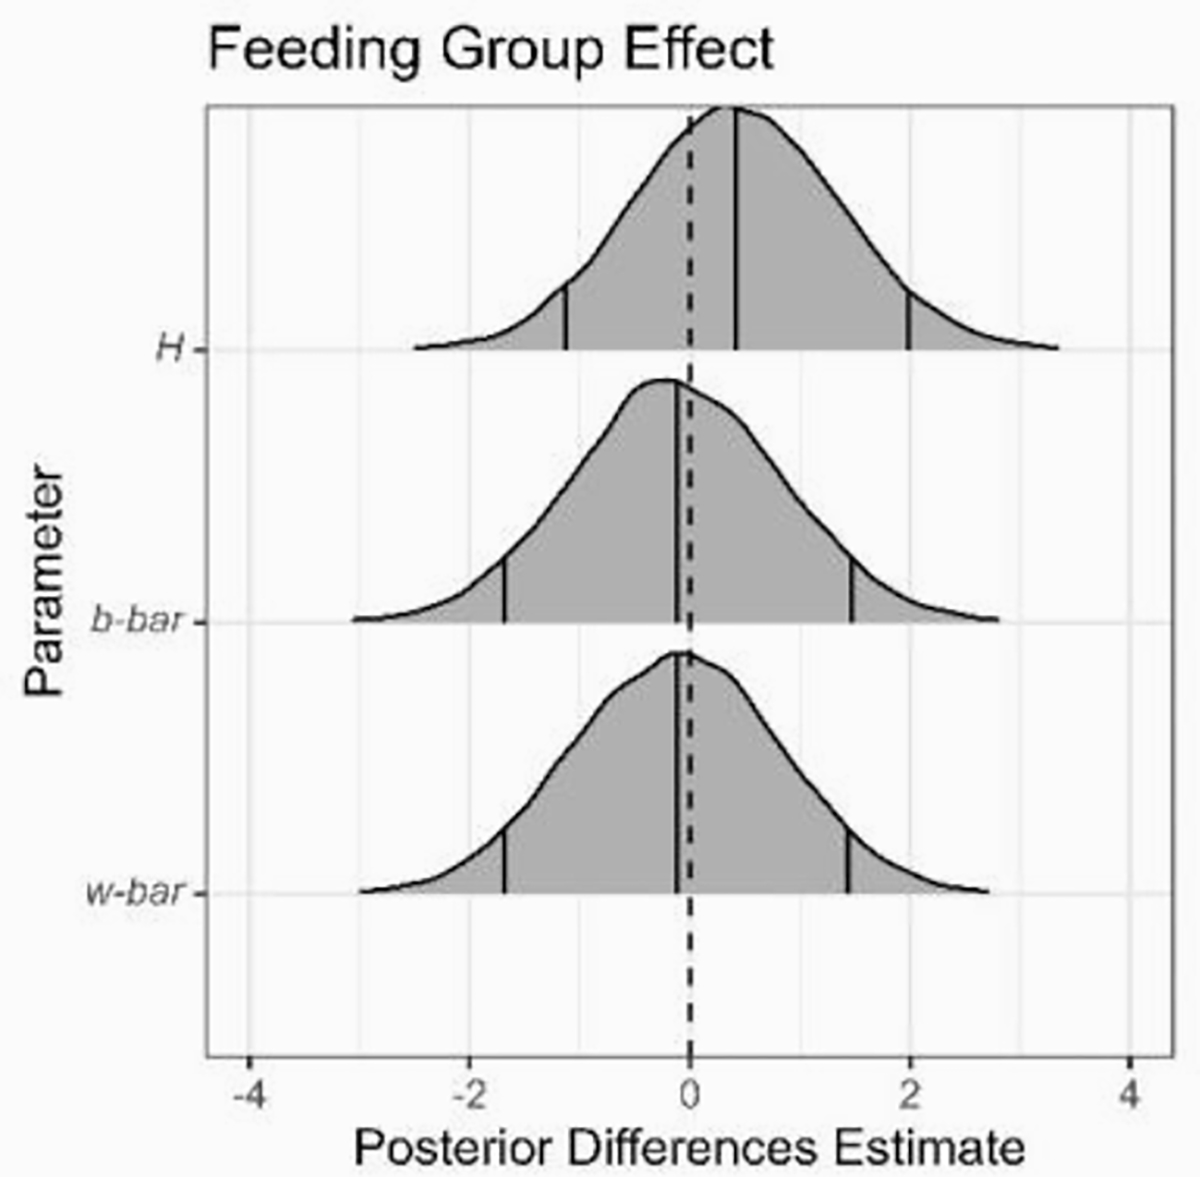
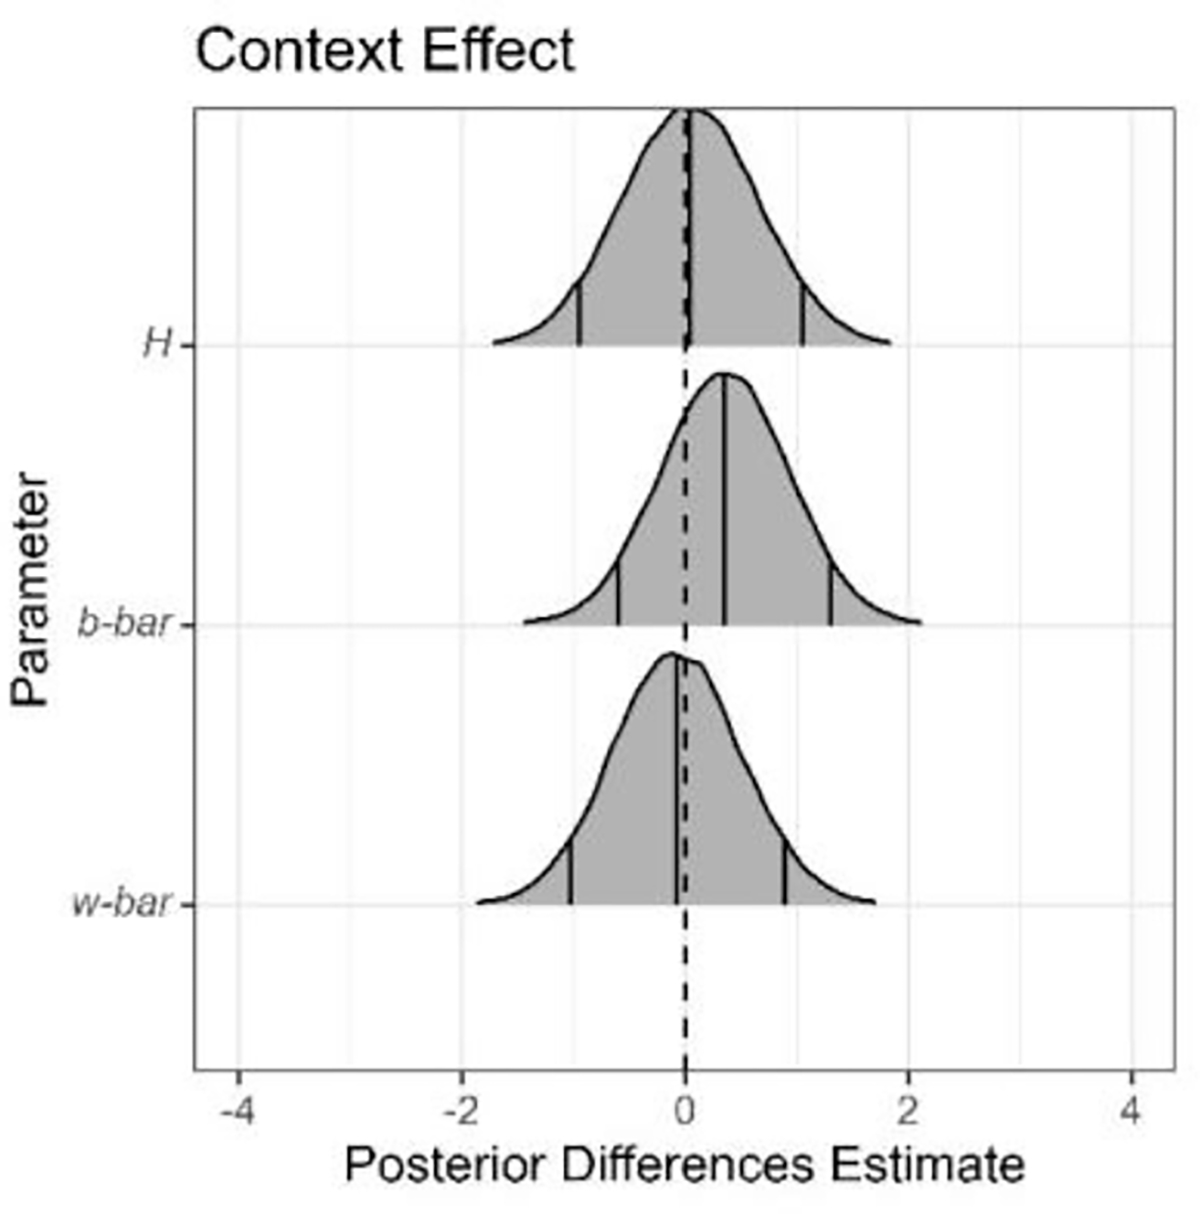
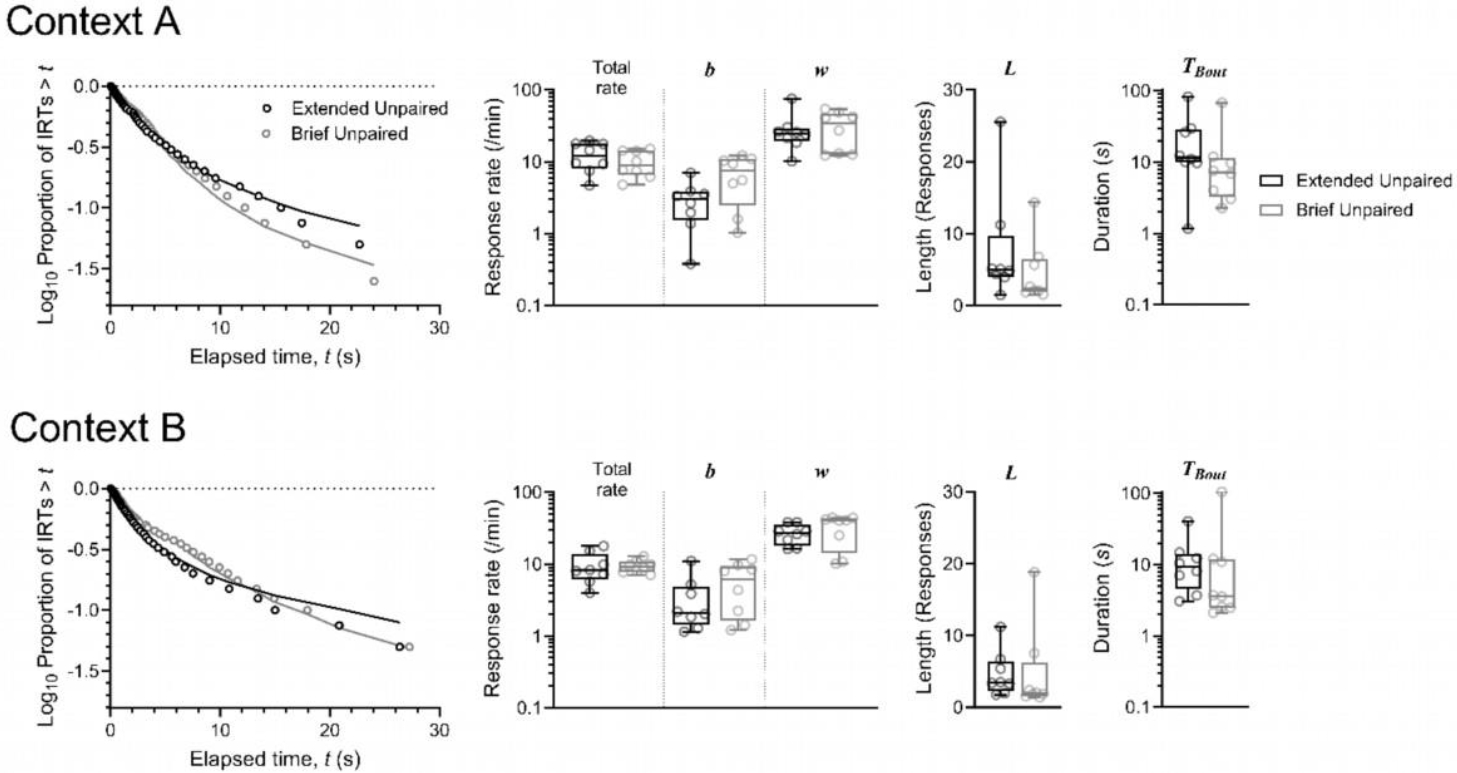
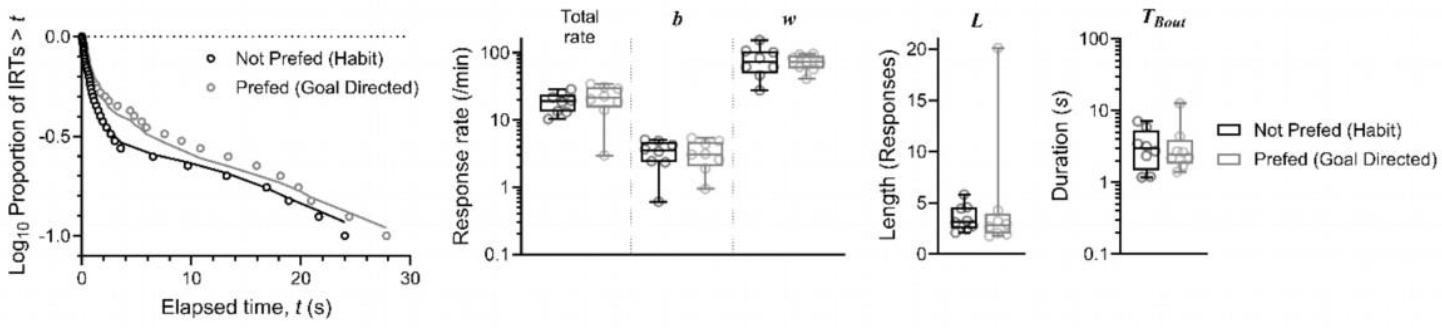
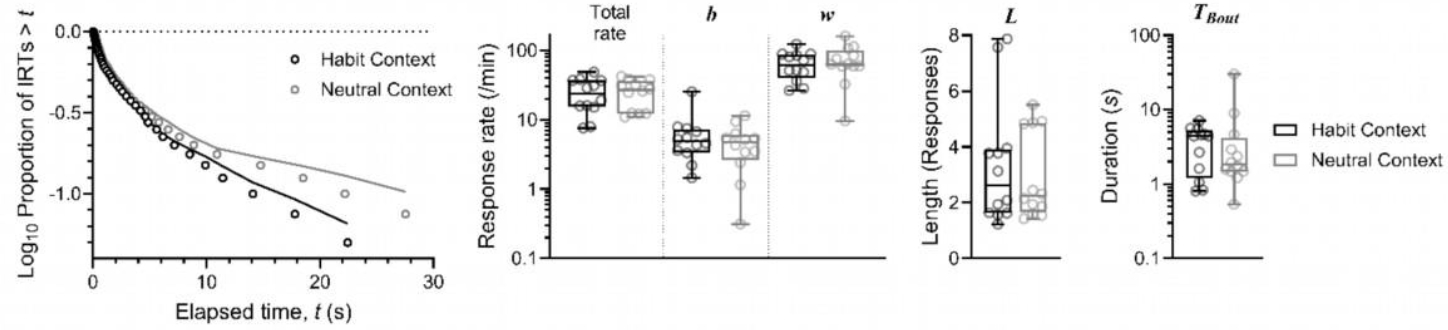
Operant behavior can reflect the influence of goal-directed and habitual processes. These can be distinguished by changes to response rate following devaluation of the reinforcing outcome. Whether a response is goal directed or habitual depends on whether devaluation affects response rate. Response rate can be decomposed into frequencies of bouts and pauses by analyzing the distribution of interresponse times. This study sought to characterize goal-directed and habitual behaviors in terms of bout-initiation rate, within-bout response rate, bout length, and bout duration. Data were taken from three published studies that compared sensitivity to devaluation following brief and extended training with variable-interval schedules. Analyses focused on goal-directed and habitual responding, a comparison of a habitual response to a similarly trained response that had been converted back to goal-directed status after a surprising event, and a demonstration of contextual control of habit and goal direction in the same subjects. Across experiments and despite responses being clearly distinguished as goal directed and habitual by total response rate, analyses of bout-initiation rate, within-bout rate, bout length, and bout duration did not reveal a pattern that distinguished goal-directed from habitual responding.
Keywords: bout analysis; context; goal-directed action; habit; operant.
© 2023 The Authors. Journal of the Experimental Analysis of Behavior published by Wiley Periodicals LLC on behalf of Society for the Experimental Analysis of Behavior.
Conflict of interest statement
CONFLICT OF INTEREST STATEMENT
The authors declare no conflicts of interest.
Figures
Similar articles
-
Costly habitual avoidance is reduced by concurrent goal-directed approach in a modified devaluation paradigm.Behav Res Ther. 2021 Nov;146:103964. doi: 10.1016/j.brat.2021.103964. Epub 2021 Sep 10. Behav Res Ther. 2021. PMID: 34547635
-
Acute stress facilitates habitual behavior in female rats.Physiol Behav. 2024 Mar 1;275:114456. doi: 10.1016/j.physbeh.2024.114456. Epub 2024 Jan 3. Physiol Behav. 2024. PMID: 38181831 Free PMC article.
-
Acute drug effects on habitual and non-habitual responding in crossed high alcohol preferring mice.Psychopharmacology (Berl). 2018 Jul;235(7):2167-2175. doi: 10.1007/s00213-018-4914-8. Epub 2018 Apr 30. Psychopharmacology (Berl). 2018. PMID: 29713788 Free PMC article.
-
Goal-Directed and Habitual Control in Human Substance Use: State of the Art and Future Directions.Neuropsychobiology. 2022;81(5):403-417. doi: 10.1159/000527663. Epub 2022 Nov 4. Neuropsychobiology. 2022. PMID: 36349761 Review.
-
Habit and persistence.J Exp Anal Behav. 2024 Jan;121(1):88-96. doi: 10.1002/jeab.894. Epub 2023 Dec 27. J Exp Anal Behav. 2024. PMID: 38149526 Free PMC article. Review.
References
-
- Aarts H (2007). Health and goal-directed behavior: The nonconscious regulation and motivation of goals and their pursuit. Health Psychology Review, 1(1), 53–82. 10.1080/17437190701485852 - DOI
-
- Abiero AR, & Bradfield LA (2021). The contextual regulation of goal-directed actions. Current Opinion in Behavioral Sciences, 41, 57–62. 10.1016/j.cobeha.2021.03.022 - DOI
-
- Adams CD (1982). Variations in the sensitivity of instrumental responding to reinforcer devaluation. The Quarterly Journal of Experimental Psychology Section B, 34(2), 77–98. 10.1080/14640748208400878 - DOI
-
- Adams CD, & Dickinson A (1981). Instrumental responding following reinforcer devaluation. The Quarterly Journal of Experimental Psychology Section B, 33(2), 109–121. 10.1080/14640748108400816 - DOI
MeSH terms
Grants and funding
LinkOut - more resources
Full Text Sources
