. 2024 Jan 1;72(Suppl 1):S111-S118.
doi: 10.4103/IJO.IJO_976_23. Epub 2023 Dec 22.

Histopathology and electron microscopy evaluation of the sildenafil effect on diabetic rats' retinae

Affiliations

Histopathology and electron microscopy evaluation of the sildenafil effect on diabetic rats' retinae

Dina Tadros et al. Indian J Ophthalmol. .

Abstract

Purpose: Although there is increasing evidence that phosphodiesterase-5 (PDE-5) inhibitors modify the effect of diabetes on different tissues, its effect on diabetic retinopathy is not well studied.

Methods: Forty male Sprague-Dawley (SD) rats were divided into four groups: group I = control group that received no treatment; group II (diabetic group), in which diabetes was induced by a single streptozotocin injection; group III (sildenafil small dose, SSD), in which diabetes was similarly introduced (however, rats received daily oral 1 mg/kg sildenafil citrate (SC) for 3 months); and group IV (sildenafil large dose, SLD), which was as in group 3, but SC was 2.5 mg/kg. After 3 months, globes were removed and retinae were dissected; one globe from each rat was examined by light microscopy (LM), and the other by electron microscopy (EM).

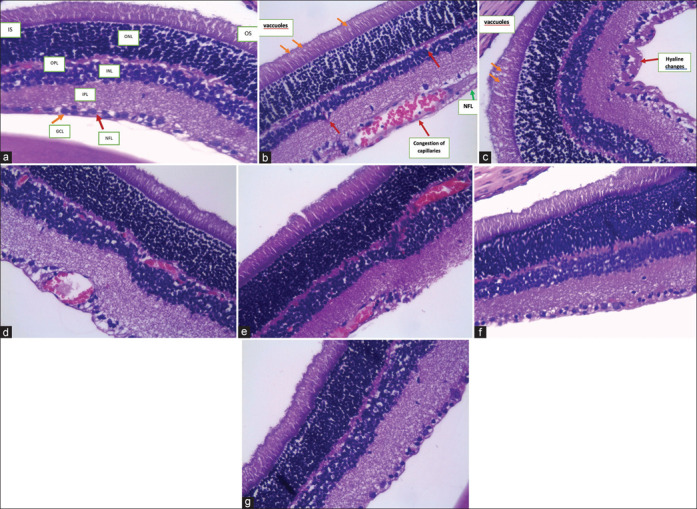
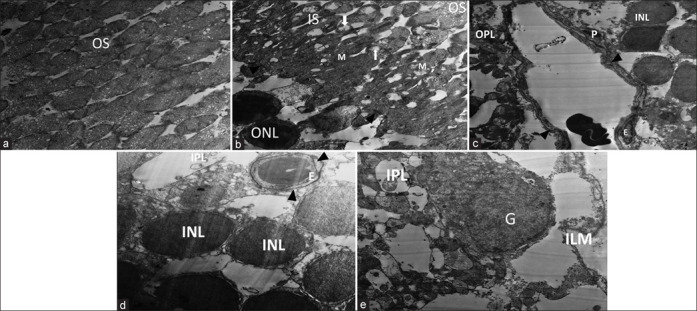
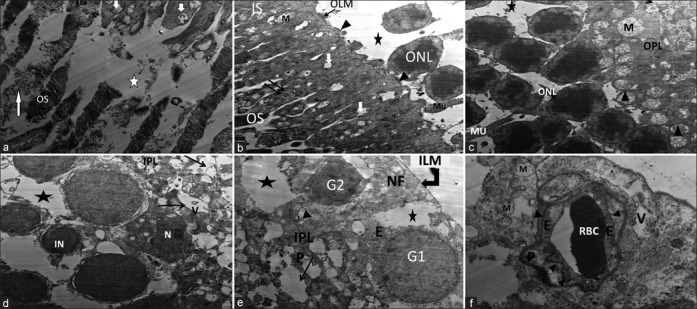
Results: In contrast to the control group, diabetic rats in group II demonstrated well-established diabetic changes in the form of capillary congestion, decreased cell population, hyaline changes of capillary walls, and degenerated nerve fiber layer by LM. Similarly, EM demonstrated photoreceptor degeneration, mitochondrial cristolysis, and vacuolated depleted cells among other features in group II. These diabetic features were less prominent in group III and nearly absent in group IV.

Conclusion: SC use in the early stages of DR may prevent/delay diabetic retinopathy development or progression in diabetic rat models, an effect that seems to be dose-related.


Conflict of interest statement

There are no conflicts of interest.

Figures

Figure 1
Figure 1
Light microscopy photos (H and E Staining) of the four tested groups [magnification (x400)]. (a) Group (I): Control group showing normal retinal structures: outer segment (OS) and inner segment (IS) of photoreceptors, outer limiting membrane (OLM), outer nuclear layer (ONL), outer plexiform layer (OPL), inner nuclear layer (INL), inner plexiform layer (IPL), ganglion cell layer (GCL), optic nerve fiber layer (NFL), and inner limiting membrane (ILM) with occasional blood capillaries in OPL. (b) Group (II) (STZ group): Showing vacuoles in the outer segment, congestion of capillaries in the ganglion cell layer, decreased cell population in the inner nuclear layer (INL) and ganglion cell layer (GCL), and degenerated optic nerve fiber layer (NFL). (c) Group (II) (STZ group): Showing vacuoles in the outer layer, decreased cell population in the inner nuclear layer (INL) and ganglion cell layer (GCL), and degenerated optic nerve fiber layer (NFL) with hyaline changes of capillary walls. (d) Group (II) (STZ group): Showing vacuoles in the outer layer, decreased cell population in the inner nuclear layer (INL) and ganglion cell layer (GCL), and degenerated optic nerve fiber layer (NFL) with congested capillaries. (e) Group (III) (SSD group): Showing fewer vacuoles than group II and increased cell population compared to group II. Congestion of the capillaries in the ganglion cell layer (GCL) and outer plexiform layer (OPL) is still prominent. (f) Group (IV) (SLD): Showing few vacuoles in OS and increased cell population in the INL and GCL compared to the control group. (g) Group (IV) (SLD): Showing fewer vacuoles in OS and increased cell population in the INL and GCL compared to the control group
Figure 2
Figure 2
Electron microscopy photos of group I: Control group [Magnification (x8780)]. (a) Showing normal-looking closely adjacent outer segments (OS) containing the disc plate of photoreceptors cut perpendicular to their direction. (b) Showing part of outer segments (OS) and normal-looking adjacent inner segment (IS) of photoreceptors and containing normal mitochondria (M) or mitochondria with focal critolysis (short arrow). The outer nuclear layer (ONL) is seen with the nearby outer limiting membrane (arrowhead). (c) Shows the outer plexiform layer (OPL) and inner nuclear layer (INL), as well as blood capillary lined by continuous endothelium (E) surrounded with basal lamina (arrowhead) and pericyte (P). (d) Shows the inner nuclear layer (INL) and part of the inner plexiform layer (IPL) containing blood capillary lined by continuous endothelium (E) with continuous intact basal lamina (arrowhead). (e) Shows the inner plexiform layer (IPL) containing normal and rarified swollen synaptic nerve terminals and ganglion cell layer with normal euchromatic nucleus (G) with nearby inner limiting membrane
Figure 3
Figure 3
Electron microscopy photos of group II: Diabetic group [Magnification (x8780)]. (a) Showing disintegration and fragmentation (long arrow) of the outer segments (OS) and disconnection (*) from swollen vacuolated inner segment (IS) of photoreceptors in association with mitochondrial cristolysis (thick short arrow). (b) Showing part of outer segments (OS) and swollen vacuolated inner segment (IS) of photoreceptors containing many mitochondria with fragmented cristae (double arrows) or cristolysis (short arrow). Depleted outer nuclear layer (ONL) together with thinning, attenuation, and discontinuity (arrowhead) of the outer limiting membrane (OLM) are observed. Notice the process of Muller cell (Mu) separated from adjacent photoreceptors. (c) Showing outer nuclear layer (ONL) and outer plexiform layer (OPL) containing some synaptic nerve terminals. Few nerve fibers display rarefaction and swelling of the mitochondria with cristolysis (arrow). Notice wide intercellular space containing thin detached process of muller cell (MU). Synaptic contact shows a thin electron-dense line (>). (d) Showing the vacuolated inner nuclear layer of a bipolar cell displaying dilated perinuclear cisternae and abnormal chromatin condensation (N) or irregular nuclear profile. The inner plexiform layer (IPL) exhibits swollen vacuolated rarefied synaptic terminals (arrow). (e) Shows the vacuolated inner plexiform layer containing rarified swollen synaptic nerve terminals. The ganglion cell layer shows normal euchromatic nucleus (G!) and karyolitic nucleus (fading nucleus (G2)). The nerve fiber layer is vacuolated (*), disrupted, and bounded by the inner limiting membrane (ILM). (f) Shows blood capillary in the nerve fiber layer containing red blood cells and is formed of swollen continuous endothelium (E) surrounded by irregular basal lamina of uneven thickness (arrowhead) and swollen pericyte (P). The surrounding nerve fiber layer is vacuolated (V) and displays swollen nerve fibers containing mitochondria with a rarified matrix (M)
Figure 4
Figure 4
Electron microscopy photos of group III: Small dose group (SSD) [Magnification (x8780)]. (a) Showing normally oriented lamellar discs of outer segments (OS) except for a few disrupted electron-dense ones (D). They are connected to the inner segment (IS) of photoreceptors containing many mitochondria, with a few of them displaying cristolysis (short arrow). (b) Showing part of outer segments (OS) and nearly normal-looking inner segment (IS) of photoreceptors containing many mitochondria, with a few of them exhibiting cristolysis (short arrow). The outer nuclear layer (ONL) is seen with the nearby outer limiting membrane (OLM) (arrowhead). (c) Showing the outer nuclear layer (ONL) and outer plexiform layer (OPL) containing synaptic nerve terminals. Notice a wide intercellular space containing thin detached process of muller cell (MU). Synaptic contact shows a thin electron-dense line (>). (d) Showing the vacuolated (V) inner nuclear layer of a bipolar cell (INL). The inner plexiform layer (IPL) exhibits swollen vacuolated (V) rarefied synaptic terminals (R). The blood capillary displays normal endothelium (E) and pericyte (P) with basal lamina in between (arrowhead). (e) Showing vacuolated inner plexiform layer (IPL) containing normal and rarified swollen synaptic nerve terminals. The ganglion cell layer shows a normal euchromatic nucleus (G). The nerve fiber layer is seen bounded by the inner limiting membrane (ILM). Notice blood capillary lined by continuous endothelium (E)
Figure 5
Figure 5
Electron microscopy photos of group IV: Large dose group (SLD) [Magnification (x8780)]. (a) Shows normal-looking outer segments (OS) containing the disc plate of photoreceptors cut perpendicular to their direction. (b) Showing part of outer segments (OS) and normal-looking inner segment (IS) of photoreceptors, with a few of them vacuolated and containing normal mitochondria (M) or mitochondria with focal critolysis (short arrow). The outer nuclear layer (ONL) is seen with the nearby outer limiting membrane (arrowhead). (c) Showing the outer nuclear layer (ONL) and outer plexiform layer (OPL) containing synaptic nerve terminals. The myoid region (MY) of photoreceptors is seen as a narrow band below the nuclear region and before the synaptic area. The outer plexiform layer is seen containing multiple synapses (arrow). The nearby inner nuclear layer (INL) is seen containing blood capillary lined by continuous endothelium (E) and pericyte (P) with basal lamina in between (arrowhead). (d) Inner plexiform layer (IPL) containing normal and rarified swollen synaptic nerve terminals and ganglion cell layer with normal euchromatic nucleus (G). (e) Shows the inner plexiform layer (IPL) containing normal and rarified swollen synaptic nerve terminals. The nerve fiber layer is seen bounded by the inner limiting membrane (ILM). Notice the blood capillary lined by continuous endothelium (E) surrounded by basal lamina and pericyte

References

    1. Zahran MH, Hussein AM, Barakat N, Awadalla A, Khater S, Harraz A, et al. Sildenafil activates antioxidant and antiapoptotic genes and inhibits proinflammatory cytokine genes in a rat model of renal ischemia/reperfusion injury. Int Urol Nephrol. 2015;47:1907–15. - PubMed
    1. Foresta C, Caretta N, Zuccarello D, Poletti A, Biagioli A, Caretti L, et al. Expression of the PDE5 enzyme on human retinal tissue: New aspects of PDE5 inhibitors ocular side effects. Eye (Lond) 2008;22:144–9. - PubMed
    1. Sorour OA, Liu K, Mehta N, Braun P, Gendelman I, Nassar E, et al. Visual and anatomic outcomes of sustained single agent anti-VEGF treatment versus double anti-VEGF switching in the treatment of persistent diabetic macular edema. Int J Retina Vitreous. 2020;6:17. - PMC - PubMed
    1. Gui F, You Z, Fu S, Wu H, Zhang Y. Endothelial dysfunction in diabetic retinopathy. Front Endocrinol (Lausanne) 2020;11:591. - PMC - PubMed
    1. Sorour OA, Mehta N, Baumal CR, Ishibazawa A, Liu K, Konstantinou EK, et al. Morphological changes in intraretinal microvascular abnormalities after anti-VEGF therapy visualized on optical coherence tomography angiography. Eye Vis (Lond) 2020;7:29. - PMC - PubMed

Substances