

Characterization of 3D NSCLC Cell Cultures with Fibroblasts or Macrophages for Tumor Microenvironment Studies and Chemotherapy Screening
- PMID: 38132110
- PMCID: PMC10742261
- DOI: 10.3390/cells12242790
Characterization of 3D NSCLC Cell Cultures with Fibroblasts or Macrophages for Tumor Microenvironment Studies and Chemotherapy Screening
Abstract
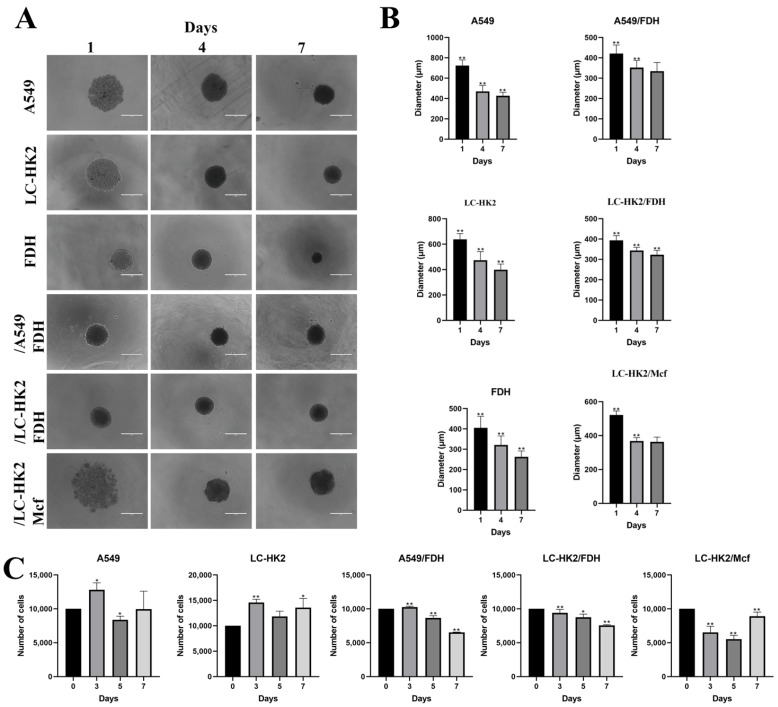
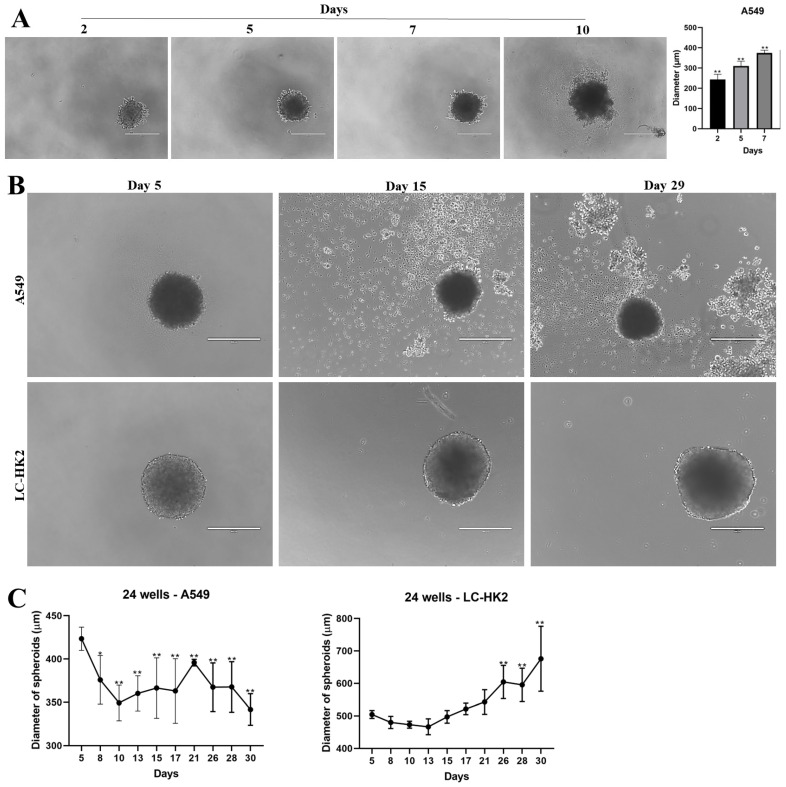
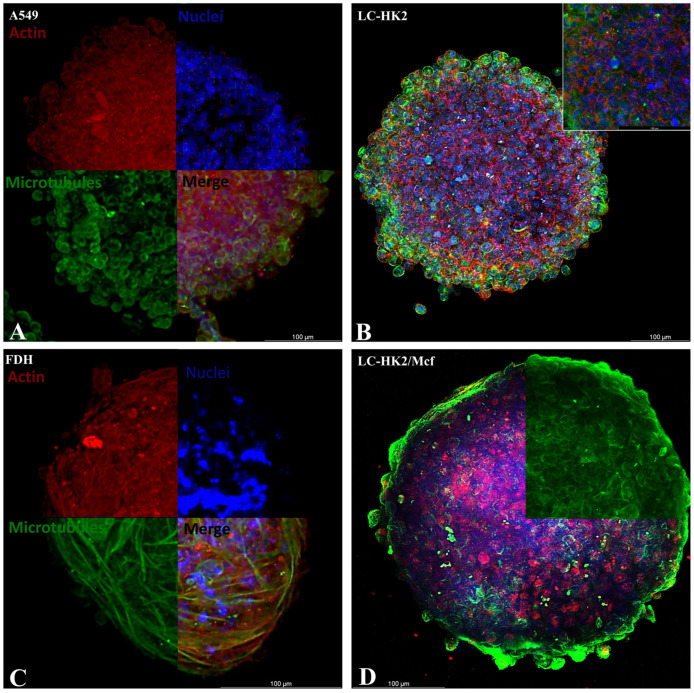
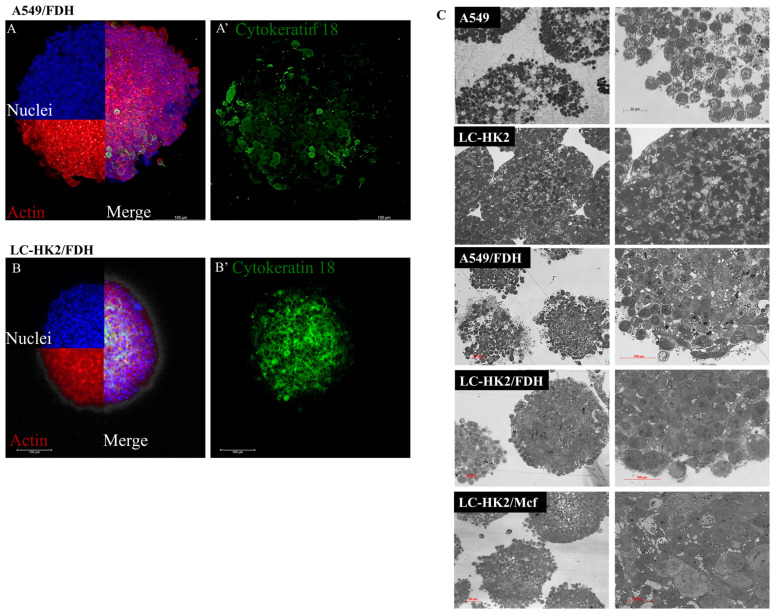
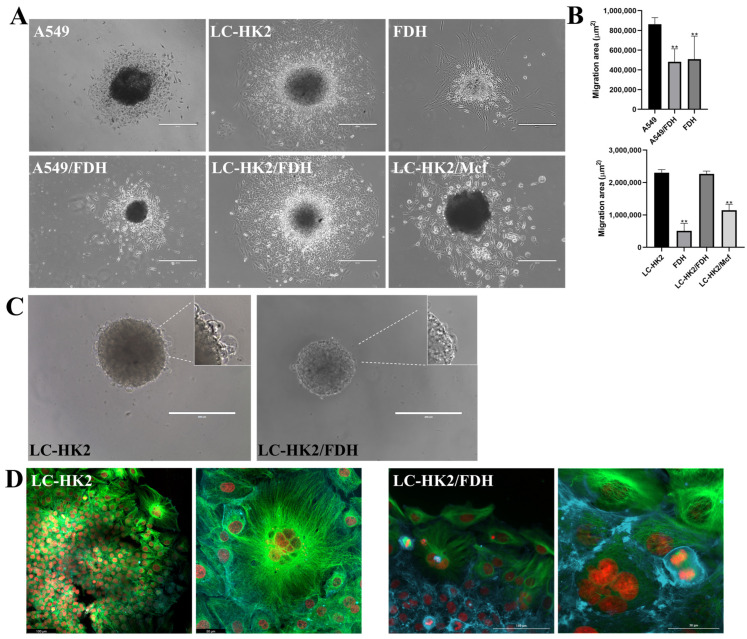
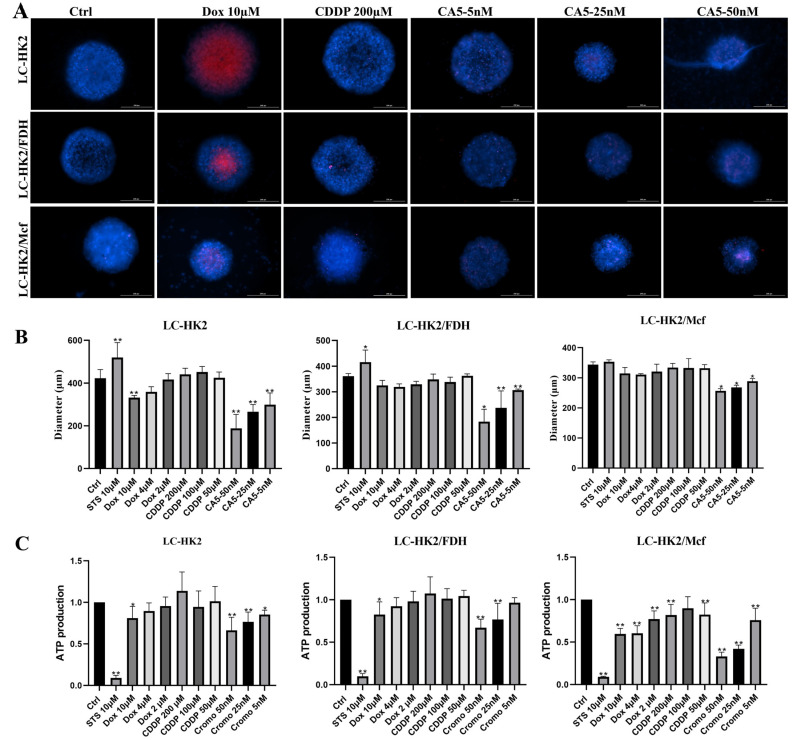
The study of 3D cell culture has increased in recent years as a model that mimics the tumor microenvironment (TME), which is characterized by exhibiting cellular heterogeneity, allowing the modulation of different signaling pathways that enrich this microenvironment. The TME exhibits two main cell populations: cancer-associated fibroblasts (CAFs) and tumor-associated macrophages (TAM). The aim of this study was to investigate 3D cell cultures of non-small cell lung cancer (NSCLC) alone and in combination with short-term cultured dermal fibroblasts (FDH) and with differentiated macrophages of the THP-1 cell line. Homotypic and heterotypic spheroids were morphologically characterized using light microscopy, immunofluorescence and transmission electron microscopy. Cell viability, cycle profiling and migration assay were performed, followed by the evaluation of the effects of some chemotherapeutic and potential compounds on homotypic and heterotypic spheroids. Both homotypic and heterotypic spheroids of NSCLC were generated with fibroblasts or macrophages. Heterotypic spheroids with fibroblast formed faster, while homotypic ones reached larger sizes. Different cell populations were identified based on spheroid zoning, and drug effects varied between spheroid types. Interestingly, heterotypic spheroids with fibroblasts showed similar responses to the treatment with different compounds, despite being smaller. Cellular viability analysis required multiple methods, since the responses varied depending on the spheroid type. Because of this, the complexity of the spheroid should be considered when analyzing compound effects. Overall, this study contributes to our understanding of the behavior and response of NSCLC cells in 3D microenvironments, providing valuable insights for future research and therapeutic development.
Keywords: 3D cell culture; co-culture; fibroblasts; macrophages; spheroids; tumor microenvironment.
Conflict of interest statement
The authors declare no conflict of interest.
Figures
Similar articles
-
Secretome profiling of heterotypic spheroids suggests a role of fibroblasts in HIF-1 pathway modulation and colorectal cancer photodynamic resistance.Cell Oncol (Dordr). 2019 Apr;42(2):173-196. doi: 10.1007/s13402-018-00418-8. Epub 2019 Feb 12. Cell Oncol (Dordr). 2019. PMID: 30756254
-
Intrinsic Differences in Spatiotemporal Organization and Stromal Cell Interactions Between Isogenic Lung Cancer Cells of Epithelial and Mesenchymal Phenotypes Revealed by High-Dimensional Single-Cell Analysis of Heterotypic 3D Spheroid Models.Front Oncol. 2022 Apr 22;12:818437. doi: 10.3389/fonc.2022.818437. eCollection 2022. Front Oncol. 2022. PMID: 35530312 Free PMC article.
-
Effect of homotypic and heterotypic interaction in 3D on the E-selectin mediated adhesive properties of breast cancer cell lines.Biomaterials. 2012 Dec;33(35):9037-48. doi: 10.1016/j.biomaterials.2012.08.052. Epub 2012 Sep 17. Biomaterials. 2012. PMID: 22992472 Free PMC article.
-
Heterotypic tumor spheroids: a platform for nanomedicine evaluation.J Nanobiotechnology. 2023 Aug 2;21(1):249. doi: 10.1186/s12951-023-02021-y. J Nanobiotechnology. 2023. PMID: 37533100 Free PMC article. Review.
-
Three-dimensional heterotypic colorectal cancer spheroid models for evaluation of drug response.Front Oncol. 2023 Jul 4;13:1148930. doi: 10.3389/fonc.2023.1148930. eCollection 2023. Front Oncol. 2023. PMID: 37469395 Free PMC article. Review.
Cited by
-
ITIH5-mediated fibroblast/macrophage crosstalk exacerbates cardiac remodelling after myocardial infarction.J Transl Med. 2025 Feb 24;23(1):224. doi: 10.1186/s12967-025-06244-5. J Transl Med. 2025. PMID: 39994656 Free PMC article.
-
A spheroid whole mount drug testing pipeline with machine-learning based image analysis identifies cell-type specific differences in drug efficacy on a single-cell level.BMC Cancer. 2024 Dec 18;24(1):1542. doi: 10.1186/s12885-024-13329-9. BMC Cancer. 2024. PMID: 39696122 Free PMC article.
-
3D cell culture models in research: applications to lung cancer pharmacology.Front Pharmacol. 2024 Sep 23;15:1438067. doi: 10.3389/fphar.2024.1438067. eCollection 2024. Front Pharmacol. 2024. PMID: 39376603 Free PMC article. Review.
-
A Novel ceRNET Relying on the lncRNA JPX, miR-378a-3p, and Its mRNA Targets in Lung Cancer.Cancers (Basel). 2024 Apr 17;16(8):1526. doi: 10.3390/cancers16081526. Cancers (Basel). 2024. PMID: 38672608 Free PMC article.
References
-
- Friedrich J., Ebner R., Kunz-Schughart L.A. Experimental Anti-Tumor Therapy in 3-D: Spheroids—Old Hat or New Challenge? Int. J. Radiat. Biol. 2007;83:849–871. - PubMed
Publication types
MeSH terms
Grants and funding
LinkOut - more resources
Full Text Sources
Other Literature Sources
Medical
