

The Enrichment of miRNA-Targeted mRNAs in Translationally Less Active over More Active Polysomes
- PMID: 38132362
- PMCID: PMC10741098
- DOI: 10.3390/biology12121536
The Enrichment of miRNA-Targeted mRNAs in Translationally Less Active over More Active Polysomes
Abstract
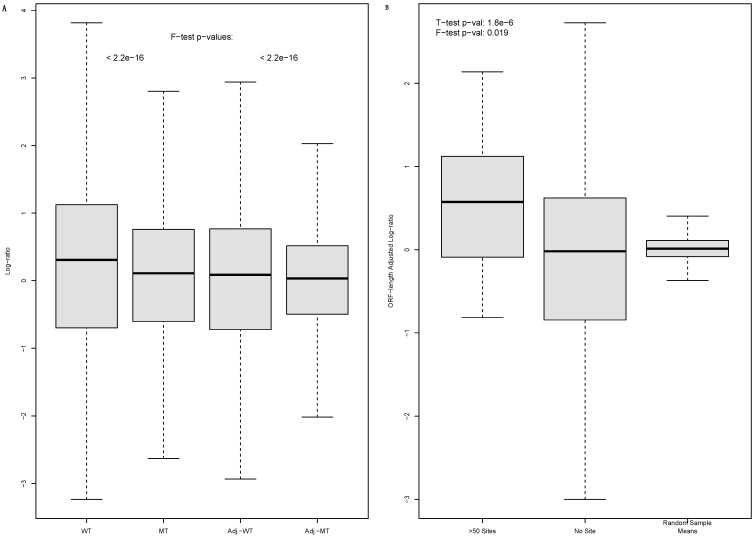
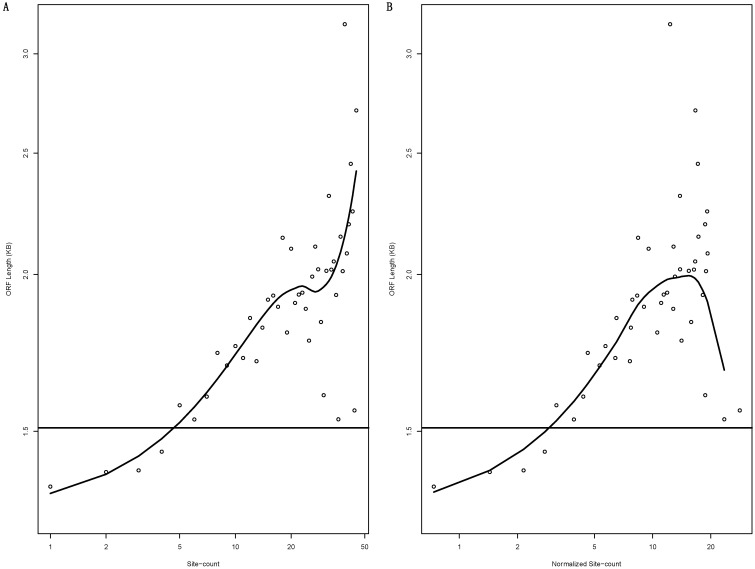
miRNAs moderately inhibit the translation and enhance the degradation of their target mRNAs via cognate binding sites located predominantly in the 3'-untranslated regions (UTR). Paradoxically, miRNA targets are also polysome-associated. We studied the polysome association by the comparative translationally less-active light- and more-active heavy-polysome profiling of a wild type (WT) human cell line and its isogenic mutant (MT) with a disrupted DICER1 gene and, thus, mature miRNA production. As expected, the open reading frame (ORF) length is a major determinant of light- to heavy-polysome mRNA abundance ratios, but is rendered less powerful in WT than in MT cells by miRNA-regulatory activities. We also observed that miRNAs tend to target mRNAs with longer ORFs, and that adjusting the mRNA abundance ratio with the ORF length improves its correlation with the 3'-UTR miRNA-binding-site count. In WT cells, miRNA-targeted mRNAs exhibit higher abundance in light relative to heavy polysomes, i.e., light-polysome enrichment. In MT cells, the DICER1 disruption not only significantly abrogated the light-polysome enrichment, but also narrowed the mRNA abundance ratio value range. Additionally, the abrogation of the enrichment due to the DICER1 gene disruption, i.e., the decreases of the ORF-length-adjusted mRNA abundance ratio from WT to MT cells, exhibits a nearly perfect linear correlation with the 3'-UTR binding-site count. Transcription factors and protein kinases are the top two most enriched mRNA groups. Taken together, the results provide evidence for the light-polysome enrichment of miRNA-targeted mRNAs to reconcile polysome association and moderate translation inhibition, and that ORF length is an important, though currently under-appreciated, transcriptome regulation parameter.
Keywords: 3′-untranslated regions (UTR); DICER1; microRNA (miRNA); more-active heavy polysome; polysome; polysome profiling; translationally less-active light polysome.
Conflict of interest statement
The authors declare no conflict of interest.
Figures


Similar articles
-
MicroRNAs control mRNA fate by compartmentalization based on 3' UTR length in male germ cells.Genome Biol. 2017 Jun 15;18(1):105. doi: 10.1186/s13059-017-1243-x. Genome Biol. 2017. PMID: 28615029 Free PMC article.
-
Biological basis for restriction of microRNA targets to the 3' untranslated region in mammalian mRNAs.Nat Struct Mol Biol. 2009 Feb;16(2):144-50. doi: 10.1038/nsmb.1552. Epub 2009 Feb 1. Nat Struct Mol Biol. 2009. PMID: 19182800 Free PMC article.
-
Alternative polyadenylation and dynamic 3' UTR length is associated with polysome recruitment throughout the cardiomyogenic differentiation of hESCs.Front Mol Biosci. 2024 Feb 6;11:1336336. doi: 10.3389/fmolb.2024.1336336. eCollection 2024. Front Mol Biosci. 2024. PMID: 38380430 Free PMC article.
-
One microRNA has the potential to target whole viral mRNAs in a given human coronavirus.Front Microbiol. 2022 Nov 10;13:1035044. doi: 10.3389/fmicb.2022.1035044. eCollection 2022. Front Microbiol. 2022. PMID: 36439806 Free PMC article. Review.
-
Regulation of the MIR155 host gene in physiological and pathological processes.Gene. 2013 Dec 10;532(1):1-12. doi: 10.1016/j.gene.2012.12.009. Epub 2012 Dec 14. Gene. 2013. PMID: 23246696 Review.
Cited by
-
Investigating Gene Expression Noise Reduction by MicroRNAs and MiRISC Reinforcement by Self-Feedback Regulation of mRNA Degradation.bioRxiv [Preprint]. 2025 Feb 15:2025.02.11.637731. doi: 10.1101/2025.02.11.637731. bioRxiv. 2025. PMID: 39990448 Free PMC article. Preprint.
-
One-Pot Detection of miRNA by Dual Rolling Circle Amplification at Ambient Temperature with High Specificity and Sensitivity.Biosensors (Basel). 2025 May 15;15(5):317. doi: 10.3390/bios15050317. Biosensors (Basel). 2025. PMID: 40422056 Free PMC article.
References
Grants and funding
LinkOut - more resources
Full Text Sources
Molecular Biology Databases
Research Materials
