

Regulatory and Interacting Partners of PDLIM7 in Thyroid Cancer
- PMID: 38132395
- PMCID: PMC10742985
- DOI: 10.3390/curroncol30120761
Regulatory and Interacting Partners of PDLIM7 in Thyroid Cancer
Abstract
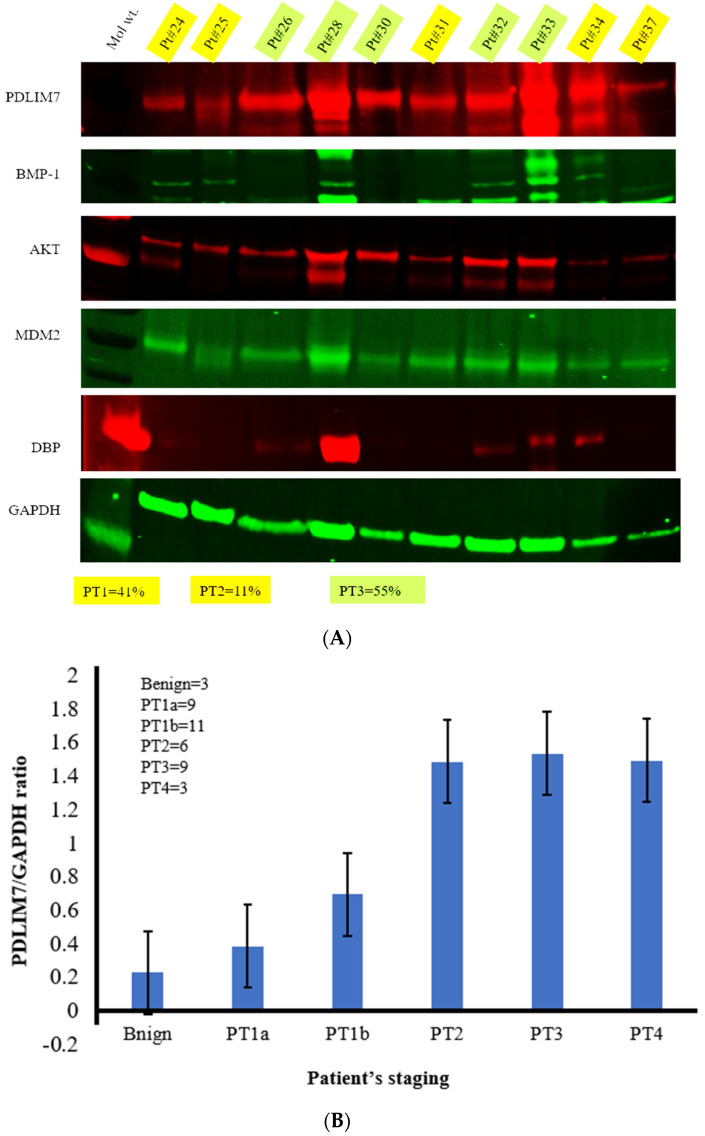
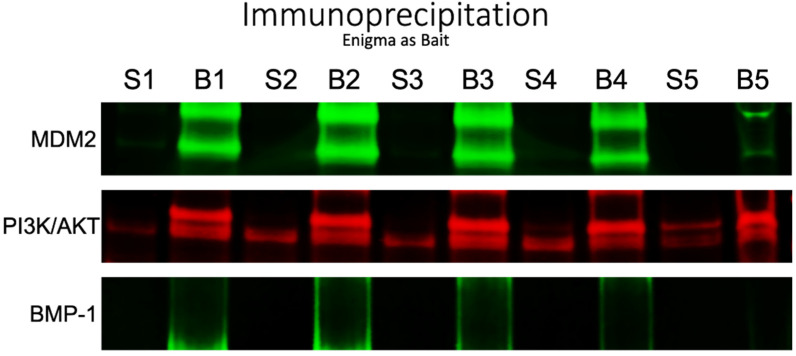
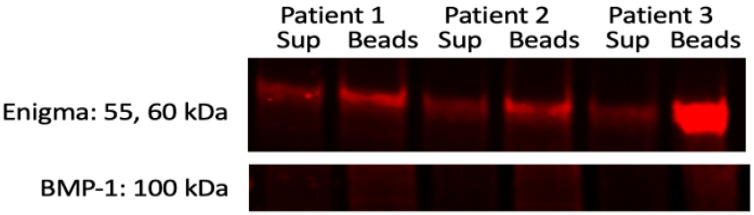
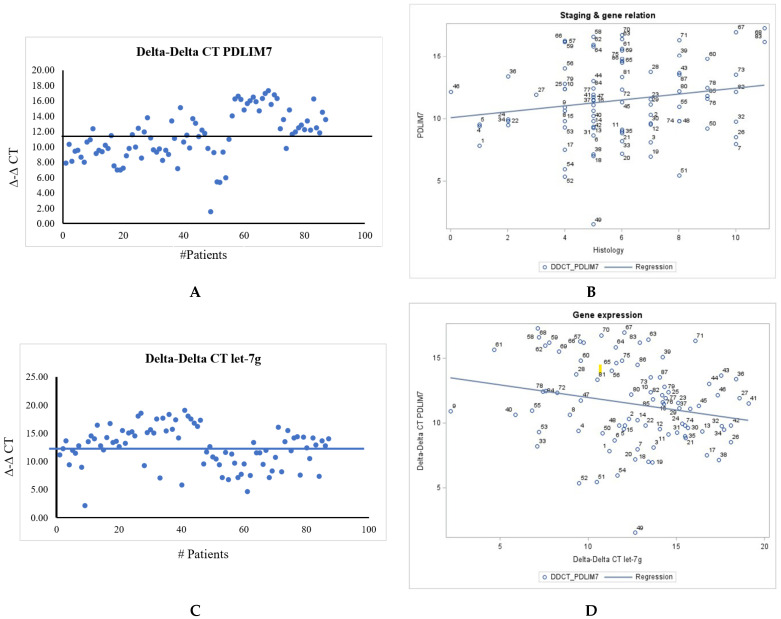
Enigma protein, encoded by the PDLIM7 gene, is overexpressed in thyroid cancer in a stage-dependent manner, suggesting a potential involvement in the initiation and progression of thyroid cancer. The Enigma interacts with several cellular pathways, including PI3K/AKT, MDM2, and BMP-1. The Enigma is regulated by microRNAs. Specifically, we showed that the Enigma protein upregulation corresponds to the downregulation of Let-7 family genes. There is limited research on the interactions and regulation of the Enigma with other proteins/genes in thyroid cancer tissues, indicating a gap in current knowledge. Our aim is to establish the Enigma as a biomarker. We also aim to study the interacting partners of the Enigma signaling pathways and their probable miRNA regulation in thyroid cancer progression. Using Western blotting, densitometric analysis, immunoprecipitation (IP), and reverse IP, we detected the protein expression and protein-protein interactions in the corresponding papillary thyroid carcinomas (PTCs). Utilizing real-time qPCR assay and Pearson's correlation test, we highlighted the correlation between PDLIM7 and Let-7g gene expression in the same tissues. The results showed the differential upregulations of the Enigma protein in different stages of PTCs compared to benign tissues along with AKT, VDR, BMP-1, and MDM2 proteins. Loss of DBP was observed in a subset of PTCs. Strong interactions of the Enigma with PI3K/AKT and MDM2 were noted, along with a weaker BMP-1 interaction. Pearson's correlation coefficient analysis between PDLIM7 and let-7g gene expression was significant (p < 0.05); however, there was a weak inverse correlation (r = -0.27). The study suggests the potential utility of the PDLIM7-qPCR assay as a biomarker for thyroid cancer. The Enigma's interactions with key signaling pathways may provide valuable insights into the development of thyroid cancer. The study contributes to understanding the molecular mechanisms involving the Enigma protein in thyroid cancer and highlights its potential as a biomarker.
Keywords: BMP-1; Enigma; MDM2; PI3K/AKT; let-7g; thyroid cancer.
Conflict of interest statement
The authors declare that there is no conflict of interest regarding the publication of this article.
Figures
References
Publication types
MeSH terms
Substances
Grants and funding
LinkOut - more resources
Full Text Sources
Medical
Molecular Biology Databases
Research Materials
Miscellaneous
