. 2023 Dec 4;45(12):9709-9722.
doi: 10.3390/cimb45120606.

A Comparative Kidney Transcriptome Analysis of Bicarbonate-Loaded insrr-Null Mice

Affiliations

A Comparative Kidney Transcriptome Analysis of Bicarbonate-Loaded insrr-Null Mice

E A Gantsova et al. Curr Issues Mol Biol. .

Abstract

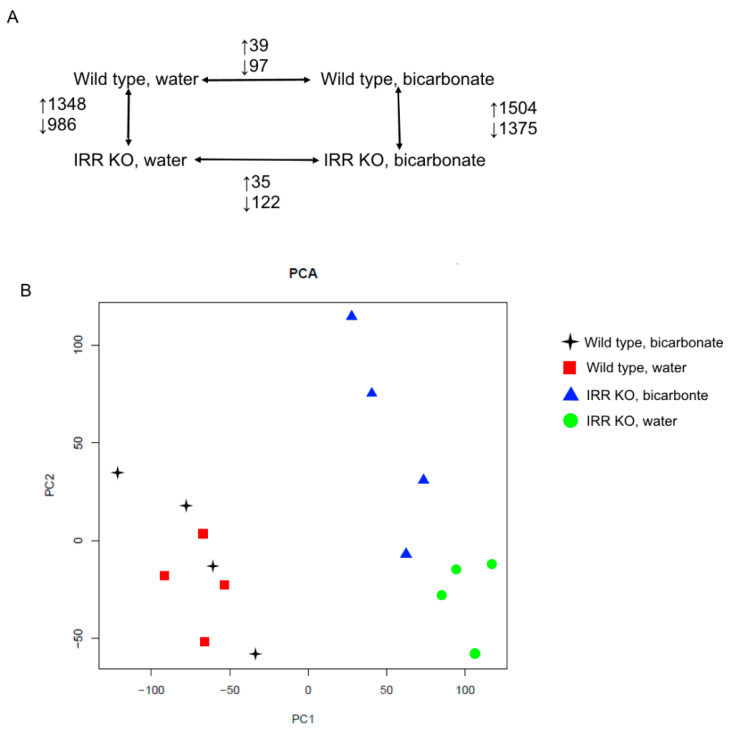
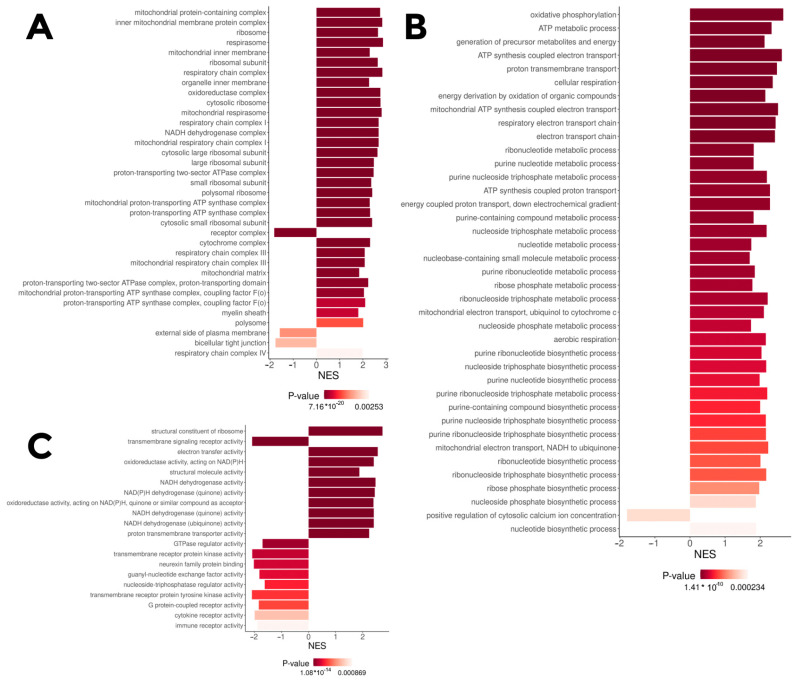
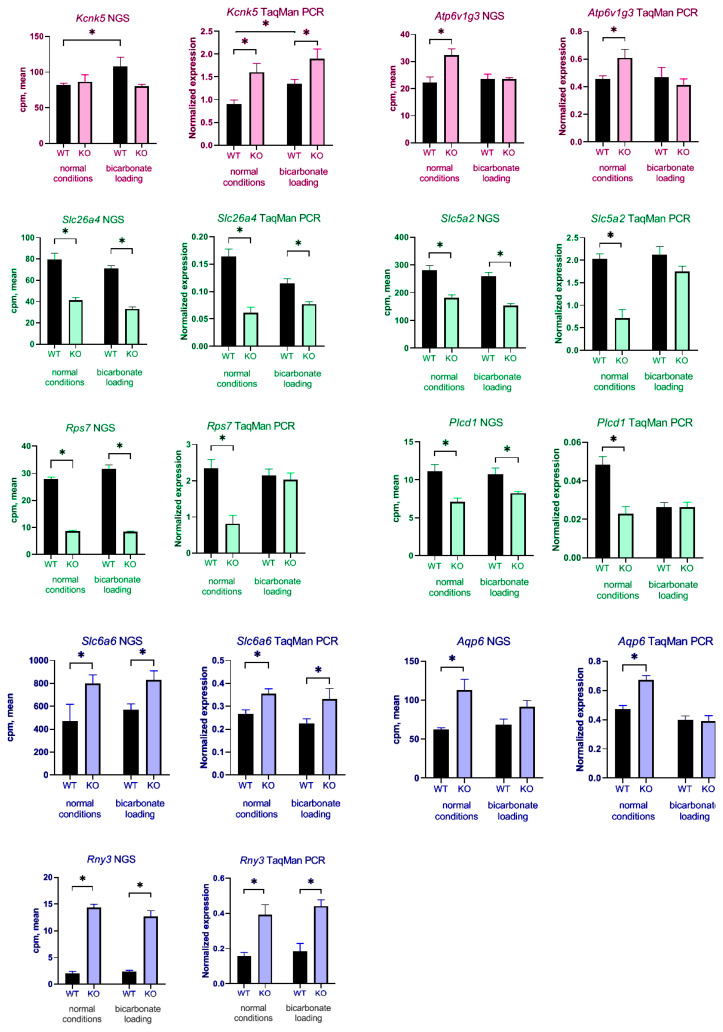
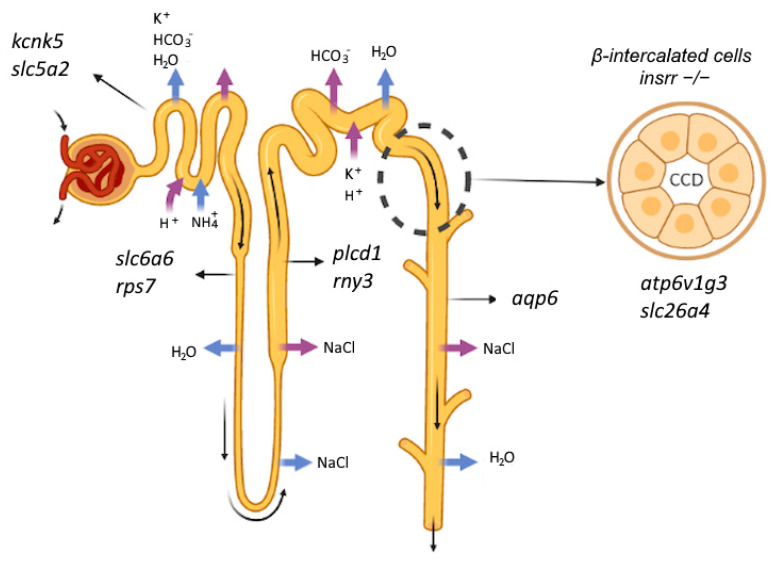
The maintenance of plasma pH is critical for life in all organisms. The kidney plays a critical role in acid-base regulation in vertebrates by controlling the plasma concentration of bicarbonate. The receptor tyrosine kinase IRR (insulin receptor-related receptor) is expressed in renal β-intercalated cells and is involved in alkali sensing due to its ability to autophosphorylate under alkalization of extracellular medium (pH > 7.9). In mice with a knockout of the insrr gene, which encodes for IRR, urinary bicarbonate secretion in response to alkali loading is impaired. The specific regulatory mechanisms in the kidney that are under the control of IRR remain unknown. To address this issue, we analyzed and compared the kidney transcriptomes of wild-type and insrr knockout mice under basal or bicarbonate-loaded conditions. Transcriptomic analyses revealed a differential regulation of a number of genes in the kidney. Using TaqMan real-time PCR, we confirmed different expressions of the slc26a4, rps7, slc5a2, aqp6, plcd1, gapdh, rny3, kcnk5, slc6a6 and atp6v1g3 genes in IRR knockout mice. Also, we found that the expression of the kcnk5 gene is increased in wild-type mice after bicarbonate loading but not in knockout mice. Gene set enrichment analysis between the IRR knockout and wild-type samples identified that insrr knockout causes alterations in expression of genes related mostly to the ATP metabolic and electron transport chain processes.

Keywords: IRR; acid–base balance; alkaline pH; alkalosis; intercalated cells; kidney; receptor tyrosine kinases.


Conflict of interest statement

The authors declare no conflict of interest.

Figures

Figure 1
Figure 1
Number of differentially expressed genes (A), PCA of the samples based on the RPKM matrix, two first principal components (B).
Figure 2
Figure 2
GO terms for which the IRR knockout differential genes under water-treatment are enriched (fgsea on logFC, adjusted p < 0.05), NES—normalized enrichment scores (positive—upregulated in knockout, negative—downregulated). (A)—GO cellular components; (B)—GO biological process; (C)—GO molecular function.
Figure 3
Figure 3
WGCNA gene dendrogram and module colors (A), size of the WGCNA gene module (B), WGCNA module eigengenes values by treatment groups, with R2 of the linear model with the following independent variables: genotype (KO or WT), treatment (bicarbonate or water) (C).
Figure 4
Figure 4
(A) Graphical plot log2(Fold change KO water/WT water) versus log2(FoldChange KO bicarbonate loading/WT bicarbonate loading) for each of DEGs found between WT and KO mice in basal state and after bicarbonate loading. Red color indicates only DEGs between WT and KO mice under basal state. (B) Graphical plot log2(Fold change WT bicarbonate loading/WT water) versus log2(FoldChange KO bicarbonate loading/KO water) for each of DEGs found after bicarbonate loading in WT and KO mice. Red color indicates only DEGs in WT after bicarbonate loading. Grey color indicates remaining DEGs.
Figure 5
Figure 5
Comparison of NGS data and TaqMan qPCR. Pink bars—genes that change their expression after bicarbonate loading (pH-sensing), green bars—genes that decreased their expression after insrr knockout, blue bars—genes that increased their expression after insrr knockout. * p-value < 0.05 compared to reference gene.
Figure 6
Figure 6
Intraperitoneal glucose-tolerance test. (A) Curve for blood glucose concentration in different time points. (B) Areas under curve for two genotypes, green—wild type, blue—knock-out IRR * p < 0.05.
Figure 7
Figure 7
Knockout of insrr gene and changes in nephron.

References

    1. Serova O.V., Gantsova E.A., Deyev I.E., Petrenko A.G. The Value of PH Sensors in Maintaining Homeostasis of the Nervous System. Russ. J. Bioorg. Chem. 2020;46:506–519. doi: 10.1134/S1068162020040196. - DOI
    1. Brown D., Wagner C.A. Molecular Mechanisms of Acid-Base Sensing by the Kidney. J. Am. Soc. Nephrol. 2012;23:774–780. doi: 10.1681/ASN.2012010029. - DOI - PMC - PubMed
    1. Deyev I.E., Popova N.V., Serova O.V., Zhenilo S.V., Regoli M., Bertelli E., Petrenko A.G. Alkaline PH Induces IRR-Mediated Phosphorylation of IRS-1 and Actin Cytoskeleton Remodeling in a Pancreatic Beta Cell Line. Biochimie. 2017;138:62–69. doi: 10.1016/j.biochi.2017.04.002. - DOI - PubMed
    1. Eladari D., Blanchard A., Leviel F., Paillard M., Stuart-Tilley A.K., Alper S.L., Podevin R.-A. Functional and Molecular Characterization of Luminal and Basolateral Cl−/HCO3− Exchangers of Rat Thick Limbs. Am. J. Physiol. Ren. Physiol. 1998;275:F334–F342. doi: 10.1152/ajprenal.1998.275.3.F334. - DOI - PubMed
    1. Deyev I.E., Rzhevsky D.I., Berchatova A.A., Serova O.V., Popova N.V., Murashev A.N., Petrenko A.G. Deficient Response to Experimentally Induced Alkalosis in Mice with the Inactivated Insrr Gene. Acta Naturae. 2011;3:114–117. doi: 10.32607/20758251-2011-3-4-114-117. - DOI - PMC - PubMed