. 2023 Dec 12;13(24):3121.
doi: 10.3390/nano13243121.

Temperature-Enhanced Exciton Emission from GaAs Cone-Shell Quantum Dots

Affiliations

Temperature-Enhanced Exciton Emission from GaAs Cone-Shell Quantum Dots

Christian Heyn et al. Nanomaterials (Basel). .

Abstract

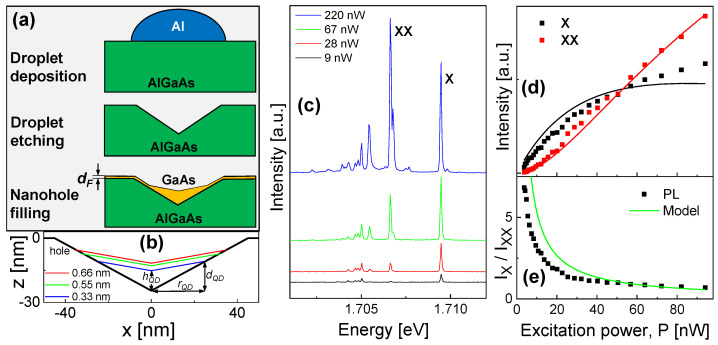
The temperature-dependent intensities of the exciton (X) and biexciton (XX) peaks from single GaAs cone-shell quantum dots (QDs) are studied with micro photoluminescence (PL) at varied excitation power and QD size. The QDs are fabricated by filling self-assembled nanoholes, which are drilled in an AlGaAs barrier by local droplet etching (LDE) during molecular beam epitaxy (MBE). This method allows the fabrication of strain-free QDs with sizes precisely controlled by the amount of material deposited for hole filling. Starting from the base temperature T = 3.2 K of the cryostat, single-dot PL measurements demonstrate a strong enhancement of the exciton emission up to a factor of five with increasing T. Both the maximum exciton intensity and the temperature Tx,max of the maximum intensity depend on excitation power and dot size. At an elevated excitation power, Tx,max becomes larger than 30 K. This allows an operation using an inexpensive and compact Stirling cryocooler. Above Tx,max, the exciton intensity decreases strongly until it disappears. The experimental data are quantitatively reproduced by a model which considers the competing processes of exciton generation, annihilation, and recombination. Exciton generation in the QDs is achieved by the sum of direct excitation in the dot, plus additional bulk excitons diffusing from the barrier layers into the dot. The thermally driven bulk-exciton diffusion from the barriers causes the temperature enhancement of the exciton emission. Above Tx,max, the intensity decreases due to exciton annihilation processes. In comparison to the exciton, the biexciton intensity shows only very weak enhancement, which is attributed to more efficient annihilation processes.

Keywords: biexciton; exciton; photoluminescence; power dependence; quantum dot; temperature dependence.


Conflict of interest statement

The authors declare no conflict of interest.

Figures

Figure 1
Figure 1
(a) Illustration of the fabrication steps for cone–shell quantum dots with the deposition of Al droplets on an AlGaAs substrate, the self-assembled droplet etching of nanoholes, and the deposition of a GaAs layer with thickness dF for nanohole filling. (b) Rotational-symmetric shape of a nanohole and of CSQDs with varied dF, as calculated according to ref. [23]. (c) PL spectra from a single GaAs CSQD with dF = 0.33 nm. The temperature is T = 3.2 K and the laser power P is varied. The labels indicate the exciton (X) and biexciton (XX) peaks. (d) Measured P-dependent intensities of the exciton and biexciton peaks (symbols) together with results of model calculations (lines) for a CSQD with dF = 0.33 nm. The intensity represents the peak area of a Lorentzian fit after background subtraction. (e) Measured ratio of of the X and XX peak intensities (symbols) as a function of P together with model results (line).
Figure 2
Figure 2
(a) Color-coded plot of a series of T-dependent spectra from a QD with dF = 0.33 nm. The exciton (X) and biexciton (XX) peaks are indicated. In addition to the X and XX lines, further multiexcitonic states in the s-shell and p-shell emission are visible due to the high excitation power of P = 900 nW. (b) Typical spectra from a QD with dF = 0.33 nm taken at P = 133 nW and varied temperature as indicated. The energy scale is normalized to the exciton energy Ex. (c) Lorentzian linewidth of the exciton peak at P = 133 nW as function of T.
Figure 3
Figure 3
Temperature dependence of the exciton peak intensity Ix normalized to the intensity Ix,0 at T = 3.2 K. The intensity represents the peak area of a Lorentzian fit after background subtraction. (ac) Results from different QDs with varied filling layer thickness dF measured at the indicated excitation power P.
Figure 4
Figure 4
(a) Maximum exciton intensity Ix,max/Ix,0 taken from the T-dependent data in Figure 3; (b) temperature Tx,max of the maximum exciton intensity (symbols) together with empirical fits in the form aPb (lines) for better visualization.
Figure 5
Figure 5
Temperature dependence of the biexciton peak intensity Ixx normalized to the intensity Ixx,0 at T = 3.2 K. (ac) Results from different QDs with varied filling layer thickness dF measured at the indicated excitation power P.
Figure 6
Figure 6
(a) Ratio of the measured exciton and biexciton intensities for a QD with dF = 0.33 nm as function of T at varied P as indicated. (b) PL spectrum of a QD with dF = 0.33 nm at T = 3.2 K and P = 3 nW. (c) PL spectrum of a QD with dF = 0.33 nm at T = 30 K and P = 27 nW. The energy scale is normalized to the exciton energy Ex.
Figure 7
Figure 7
Normalized exciton intensity Ix/Ix,0 as function of T. (a) Comparison of experimental (PL) values with model results, where the processes considered in the model are varied. All model calculations include exciton generation in the QD (Qq) and radiative recombinations Rx, Rxx. Fit D also considers exciton diffusion from the barrier into the QD, Fit D,Ab considers bulk exciton break-off, and Fit D,Ab,A considers thermal escape of charge carriers from a dot. (b) Comparison of experimental (symbols) and calculated (lines) values at varied laser power P as indicated. (c,d) Fitted exciton-annihilation related activation energies as function of P.

References

    1. Vasconcellos S.M.d., Gordon S., Bichler M., Meier T., Zrenner A. Coherent control of a single exciton qubit by optoelectronic manipulation. Nat. Photonics. 2010;4:545–548. doi: 10.1038/nphoton.2010.124. - DOI
    1. Somaschi N., Giesz V., Santis L.D., Loredo J.C., Almeida M.P., Hornecker G., Portalupi S.L., Grange T., Antón C., Demory J., et al. Near-optimal single-photon sources in the solid state. Nat. Photonics. 2016;10:340–345. doi: 10.1038/nphoton.2016.23. - DOI
    1. Keil R., Zopf M., Chen Y., Höfer B., Zhang J., Ding F., Schmidt O.G. Solid-state ensemble of highly entangled photon sources at rubidium atomic transitions. Nat. Commun. 2017;8:15501. doi: 10.1038/ncomms15501. - DOI - PMC - PubMed
    1. Huber D., Reindl M., Huo Y., Huang H., Wildmann J.S., Schmidt O.G., Rastelli A., Trotta R. Highly indistinguishable and strongly entangled photons from symmetric GaAs quantum dots. Nat. Commun. 2017;8:15506. doi: 10.1038/ncomms15506. - DOI - PMC - PubMed
    1. Arakawa Y., Holmes M.J. Progress in quantum-dot single photon sources for quantum information technologies: A broad spectrum overview. Appl. Phys. Rev. 2020;7:021309. doi: 10.1063/5.0010193. - DOI

LinkOut - more resources