

Comparison of VO2max Estimations for Maximal and Submaximal Exercise Tests in Apparently Healthy Adults
- PMID: 38133102
- PMCID: PMC10747607
- DOI: 10.3390/sports11120235
Comparison of VO2max Estimations for Maximal and Submaximal Exercise Tests in Apparently Healthy Adults
Abstract
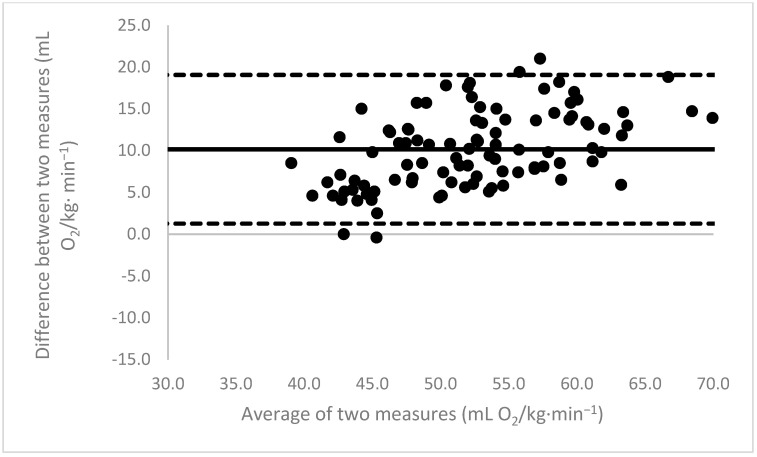
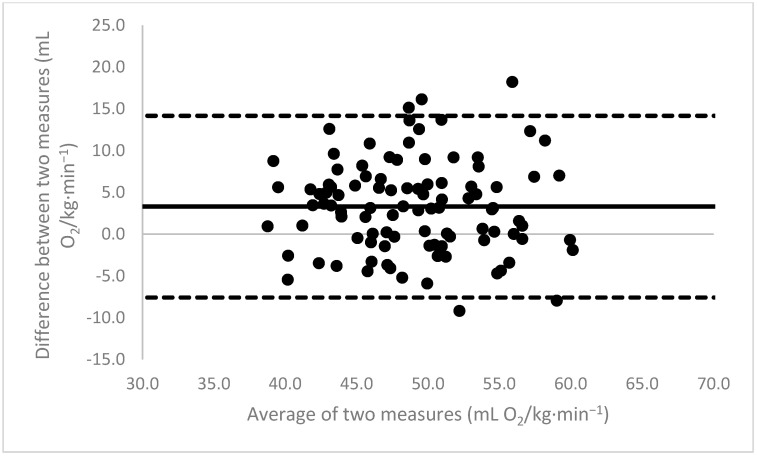
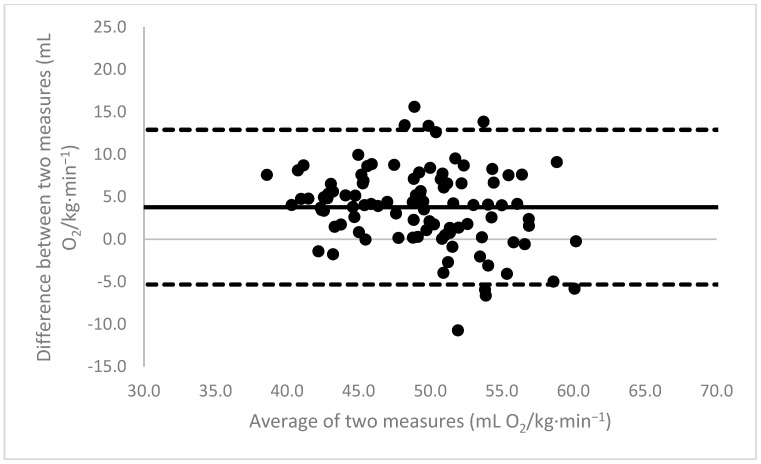
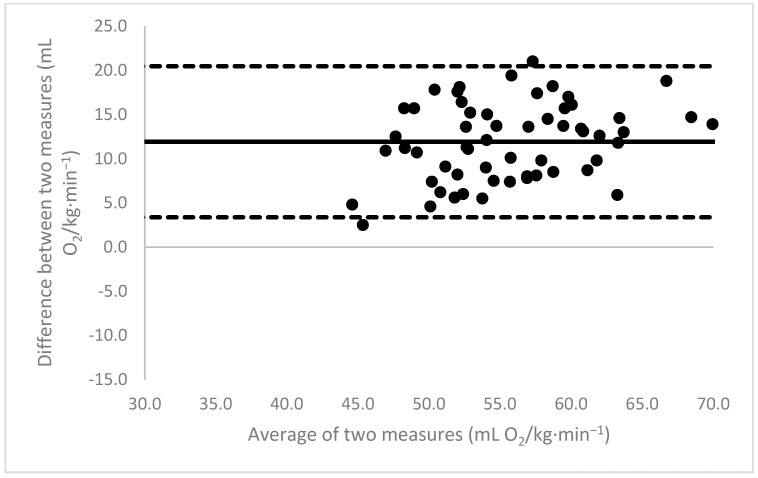
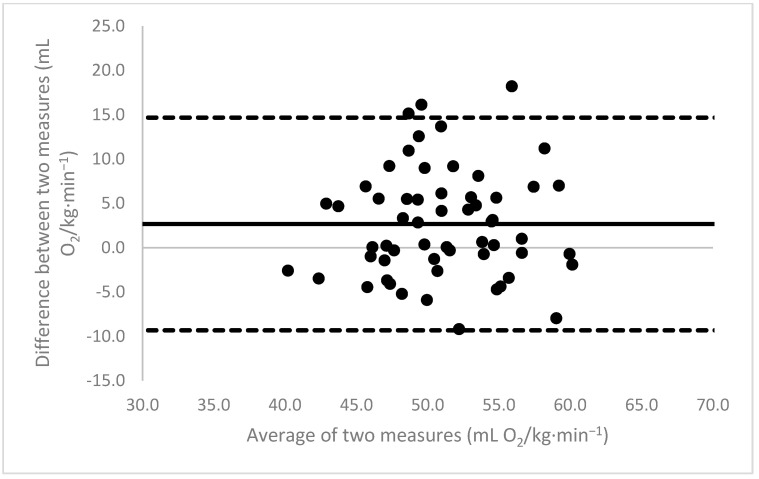
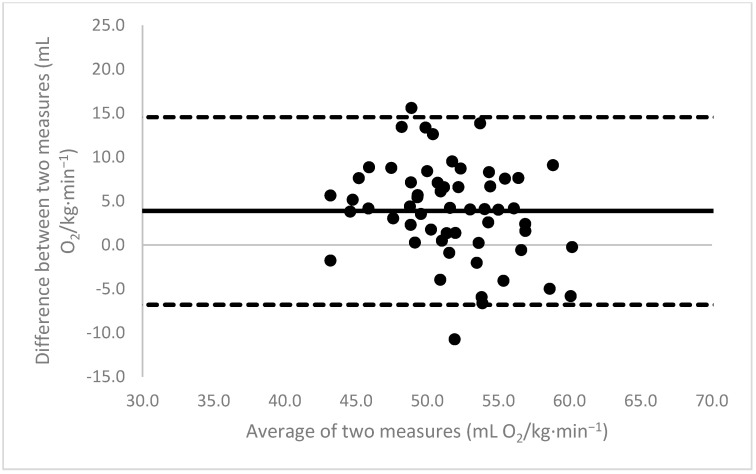
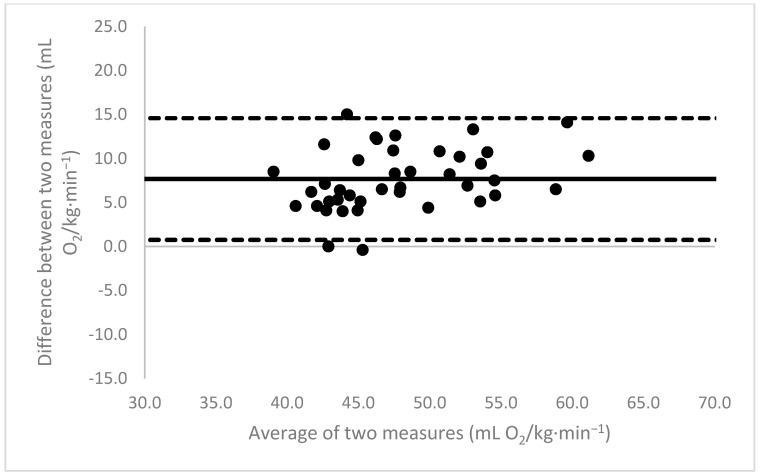
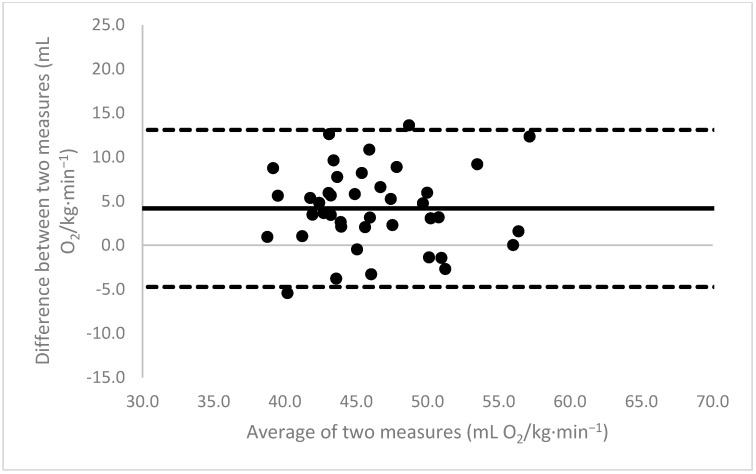
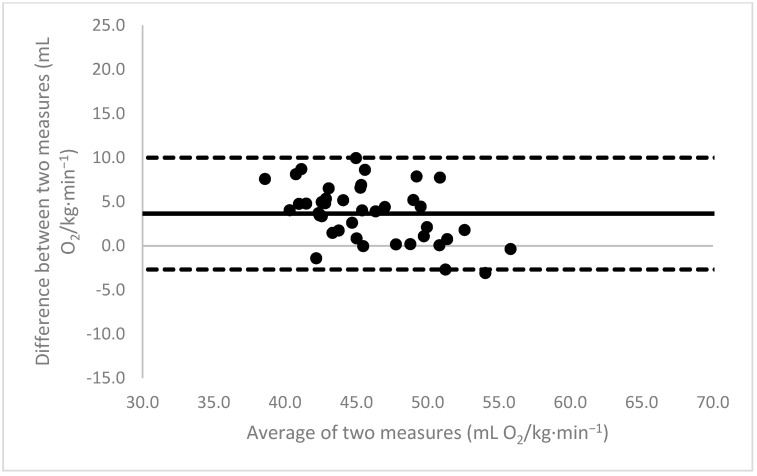
Due to limited accessibility, direct measurement of VO2max is rarely performed in clinical settings or sports centers. As a result, regression equations have been developed and are currently used during exercise tests to provide an indirect estimation. The American College of Sports Medicine (ACSM) has recommended a regression equation for running to provide an indirect estimation of VO2. However, significant differences have been observed between these estimations and directly measured VO2max. Additionally, since submaximal assessments may be more convenient for both athletes and sedentary/diseased individuals, they were included in the analysis. This study aimed to evaluate the accuracy of VO2max estimations provided using the ACSM running equation when used during both maximal and submaximal exercise tests among adult runners. A total of 99 apparently healthy and active adults (age: 39.9 ± 12.2 years; VO2max: 47.4 ± 6.0 mL O2/kg∙min-1) participated in this study. Two types of submaximal estimations were performed to predict VO2max: one based on age-predicted maximal heart rate (HRmax) (ACSMsubmax,Fox), and the second using the actual HRmax measured during the exercise test (ACSMsubmax,measured). The measured VO2max was compared to these estimations obtained from a single exercise test. Both maximal and submaximal exercise tests significantly overestimated VO2max (ACSMmax: +9.8, p < 0.001; ACSMsubmax,Fox: +3.4, p < 0.001; ACSMsubmax,measured: +3.8 mL O2/kg∙min-1, p < 0.001). However, the submaximal estimations were closer to the measured VO2max (p < 0.001). This analysis demonstrated that the included methods overestimated the true VO2max. Nonetheless, the submaximal exercise tests provided a more accurate prediction of VO2max compared to the maximal exercise tests when using the ACSM running equation.
Keywords: ACSM; VO2max; cardiorespiratory fitness; exercise test; metabolic equation; treadmill.
Conflict of interest statement
The authors declare no conflict of interest.
Figures
References
-
- Wilmore J.H., Costill D.L., Kenney L. Physiologie du Sport et de L’exercice. De Boeck Superieur; Bruxelles, Belgium: 2017.
-
- Wasserman K. Principles of Exercise Testing and Interpretation. Lippincott Williams & Wilkins; Philadelphia, PA, USA: 1999. Measurements during integrative cardiopulmonary exercise test.
-
- Martínez-Gómez R., Valenzuela P.L., Alejo L.B., Gil-Cabrera J., Montalvo-Pérez A., Talavera E., Lucia A., Moral-González S., Barranco-Gil D. Physiological predictors of competition performance in CrossFit athletes. Int. J. Environ. Res. Public Health. 2020;17:3699. doi: 10.3390/ijerph17103699. - DOI - PMC - PubMed
Grants and funding
LinkOut - more resources
Full Text Sources
Research Materials
