

The Association of Serum Calprotectin with Fitness Indicators and Biochemical Markers in High-Level Athletes: A Continuous Dynamic Monitoring during One Competitive Season
- PMID: 38133110
- PMCID: PMC10748013
- DOI: 10.3390/sports11120243
The Association of Serum Calprotectin with Fitness Indicators and Biochemical Markers in High-Level Athletes: A Continuous Dynamic Monitoring during One Competitive Season
Abstract
The objective was to determine the associations between several biochemical indicators and the dynamics of concentration change across four physical fitness phases over the period of a competitive season. Furthermore, associations between serum calprotectin and biomarkers of inflammation or muscle injury and physical indicators were examined.
Subjects and methods: Twenty professional male water polo players (median age: 28 (22-42)) were included in this study. Serum creatine kinase activity was determined by the automated photometric UV method. The concentrations of calprotectin, C-reactive protein, and myoglobin were measured using an automated immunoturbidimetric method, while an automated immunochemistry method was employed for interleukin-6, troponin I, and cortisol determination. Tests of repeated strength, maximal strength, and static strength were used to evaluate physical activity.
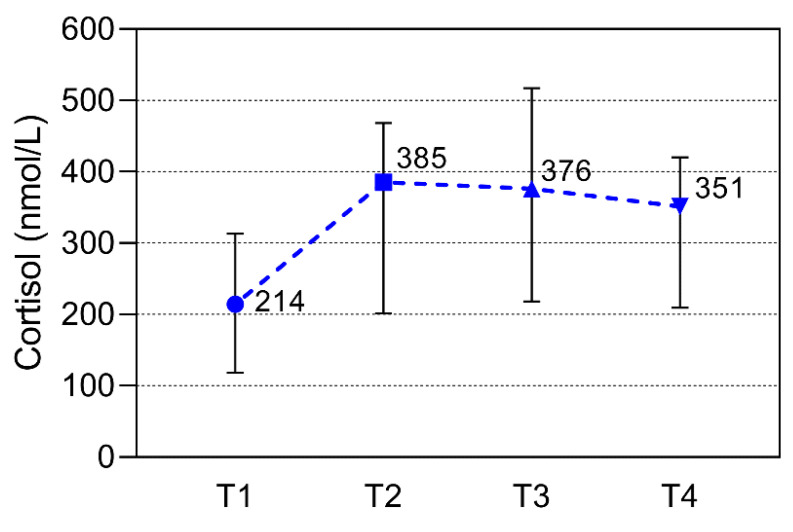
Results: Serum calprotectin concentrations expressed in median and IQR were significantly different: T1: 2.92 g/mL (2.47; 3.86); T2: 2.35 g/mL (1.26; 2.87); T3: 2.27 g/mL (1.60; 3.27); and T4: 1.47 g/mL (1.04; 2.85) (p = 0.004). Cortisol concentration and CK activity showed significant changes among phases (p = 0.049 and p = 0.014, respectively). Each physical activity examined showed a significant seasonal decrease (all p values were 0.001). Calprotectin serum concentration and indicators of muscular injury, inflammation, and physical activity were found to be correlated during particular stages of the seasonal examination.
Conclusions: Calprotectin values determined throughout one competitive season decreased as training intensity among water polo players increased. Serum calprotectin concentrations and indicators were related to biochemical markers of inflammation and muscle damage.
Keywords: biochemical markers; calprotectin; dynamic monitoring; physical fitness; water polo players.
Conflict of interest statement
The authors declare no conflict of interest.
Figures


Similar articles
-
Effects of High-Intensity Training on Complete Blood Count, Iron Metabolism, Lipid Profile, Liver, and Kidney Function Tests of Professional Water Polo Players.Diagnostics (Basel). 2024 Sep 11;14(18):2014. doi: 10.3390/diagnostics14182014. Diagnostics (Basel). 2024. PMID: 39335692 Free PMC article.
-
How training loads in the preparation and competitive period affect the biochemical indicators of training stress in youth soccer players?PeerJ. 2022 May 5;10:e13367. doi: 10.7717/peerj.13367. eCollection 2022. PeerJ. 2022. PMID: 35539014 Free PMC article.
-
A Practical Approach to Monitoring Biomarkers of Inflammation and Muscle Damage in Youth Soccer Players During a 6-Month Training Cycle.J Hum Kinet. 2021 Oct 31;80:185-197. doi: 10.2478/hukin-2021-0093. eCollection 2021 Oct. J Hum Kinet. 2021. PMID: 34868428 Free PMC article.
-
Seasonal variation in fitness parameters in competitive athletes.Sports Med. 1995 Jun;19(6):373-92. doi: 10.2165/00007256-199519060-00002. Sports Med. 1995. PMID: 7676099 Review.
-
Short-term Periodization Models: Effects on Strength and Speed-strength Performance.Sports Med. 2015 Oct;45(10):1373-86. doi: 10.1007/s40279-015-0355-2. Sports Med. 2015. PMID: 26133514 Review.
Cited by
-
Effects of High-Intensity Training on Complete Blood Count, Iron Metabolism, Lipid Profile, Liver, and Kidney Function Tests of Professional Water Polo Players.Diagnostics (Basel). 2024 Sep 11;14(18):2014. doi: 10.3390/diagnostics14182014. Diagnostics (Basel). 2024. PMID: 39335692 Free PMC article.
References
-
- Olympics Olympic Games, Medals, Results & Latest News. [(accessed on 19 September 2023)]. Available online: https://olympics.com/en/
-
- Prien A., Mountjoy M., Miller J., Boyd K., van den Hoogenband C., Gerrard D., Cherif M.Y., Lu Y., Nanousis K., Ortiz Liscano E.I., et al. Injury and Illness in Aquatic Sport: How High Is the Risk? A Comparison of Results from Three FINA World Championships. Br. J. Sports Med. 2017;51:277–282. doi: 10.1136/bjsports-2016-096075. - DOI - PubMed
Grants and funding
LinkOut - more resources
Full Text Sources
Research Materials
