. 2023 Dec 14;15(12):700.
doi: 10.3390/toxins15120700.

The Role of α3β1 Integrin Modulation on Fabry Disease Podocyte Injury and Kidney Impairment

Affiliations

The Role of α3β1 Integrin Modulation on Fabry Disease Podocyte Injury and Kidney Impairment

Bruna Bosquetti et al. Toxins (Basel). .

Abstract

Podocyte dysfunction plays a crucial role in renal injury and is identified as a key contributor to proteinuria in Fabry disease (FD), primarily impacting glomerular filtration function (GFF). The α3β1 integrins are important for podocyte adhesion to the glomerular basement membrane, and disturbances in these integrins can lead to podocyte injury. Therefore, this study aimed to assess the effects of chloroquine (CQ) on podocytes, as this drug can be used to obtain an in vitro condition analogous to the FD. Murine podocytes were employed in our experiments. The results revealed a dose-dependent reduction in cell viability. CQ at a sub-lethal concentration (1.0 µg/mL) induced lysosomal accumulation significantly (p < 0.0001). Morphological changes were evident through scanning electron microscopy and immunofluorescence, highlighting alterations in F-actin and nucleus morphology. No significant changes were observed in the gene expression of α3β1 integrins via RT-qPCR. Protein expression of α3 integrin was evaluated with Western Blotting and immunofluorescence, demonstrating its lower detection in podocytes exposed to CQ. Our findings propose a novel in vitro model for exploring secondary Fabry nephropathy, indicating a modulation of α3β1 integrin and morphological alterations in podocytes under the influence of CQ.

Keywords: Fabry disease; chloroquine; podocyte injury.


Conflict of interest statement

The authors declare no conflict of interest.

Figures

Figure 1
Figure 1
Dose–response curve of podocyte cells at different concentrations of CQ. Data were expressed as mean ± SEM of four independent experiments. The results were analyzed using ANOVA (p > 0.0001) and Dunnet’s multiple comparison test, in which **** p < 0.0001: 2 μg/mL vs. control + 3 μg/mL vs. control + 4 μg/mL vs. control + 5 μg/mL vs. control.
Figure 2
Figure 2
CQ induces increase in acid organelles. Podocytes were incubated with 1.0 μg/mL of CQ or vehicle control (culture medium) for 72 h. Acid organelles were assessed using NR and VC methods. Result is expressed as % of control (vehicle) and represents the mean ± SEM of three independent experiments. The results were analyzed using t test. **** p < 0.0001.
Figure 3
Figure 3
CQ induces increase in lysosomal inclusions. Podocytes were treated with CQ (1 µg/mL) or vehicle control (culture medium) for 72 h at 37 °C. The lysosomes (red) and nucleus (blue) were marked with the probes Lysotracker® DND-99 and DAPI, respectively. (A) Control cells (treated with culture medium)—200× magnification; (B) control cells (treated with culture medium)—600× magnification; (C) treated cells—200× magnification; and (D) treated cells—600× magnification.
Figure 4
Figure 4
Ultrastructural differences between control cells and CQ-treated cells via SEM. Images (AF) represent control cells maintained in cell culture for 17 days only in the presence of fetal bovine serum and medium (14-day maintenance period to induce cell differentiation). The (GL) images show cells maintained in culture for 14 days only in the presence of medium and fetal bovine serum for cell differentiation, later exposed to CQ (1 µg/mL) for a 72 h period. Images (A,G) are enlarged at 500×, (B,H) at 1000×, (C,I) at 4000×, (D,J) at 6000×, and (E,F,K,L) at 15,000×.
Figure 4
Figure 4
Ultrastructural differences between control cells and CQ-treated cells via SEM. Images (AF) represent control cells maintained in cell culture for 17 days only in the presence of fetal bovine serum and medium (14-day maintenance period to induce cell differentiation). The (GL) images show cells maintained in culture for 14 days only in the presence of medium and fetal bovine serum for cell differentiation, later exposed to CQ (1 µg/mL) for a 72 h period. Images (A,G) are enlarged at 500×, (B,H) at 1000×, (C,I) at 4000×, (D,J) at 6000×, and (E,F,K,L) at 15,000×.
Figure 5
Figure 5
Fluorescence analysis of CQ-treated cells under confocal microscopy. Images (AC) represent control cells maintained in cell culture for 17 days only in the presence of fetal bovine serum and medium (14-day maintenance period to induce cell differentiation). Images (DF) show cells maintained in culture for 14 days only in the presence of medium and fetal bovine serum for cell differentiation. Subsequently, they were exposed to QC (1 µg/mL) for a period of 72 h. Images (A,D) are 200× magnified, and images (B,C,E,F) are 600× magnified.
Figure 6
Figure 6
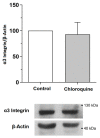
Quantitative analysis of α3 integrin via Western Blotting. Analysis of α3 integrin protein extracts in untreated (control) or CQ-treated (1 µg/mL) podocytes for 72 h at 37 °C. The values refer to the mean ± SEM of three independent experiments (n = 3). The data were analyzed using the Mann–Whitney test (ns > 0.05).
Figure 7
Figure 7
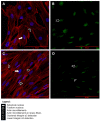
Fluorescence analysis of α3 integrin under confocal microscopy. Images (A,B) represent control cells. Images (C,D) represent cells exposed to QC (1 µg/mL) for a period of 72 h. The (B,D) images show clustered α3 integrin with lower detection after exposition to CQ. The nucleus (blue) was marked with DAPI, the F-actin cytoskeleton (red) was marked with the ActinRed™ 555 Rhodamine phalloidin probe, and α3 integrin (green) was marked with the Alexa Fluor® 647 Phalloidin probe, respectively. All images are 600× magnified.

References

    1. Battaglia Y., Fiorini F., Azzini C., Esposito P., De Vito A., Granata A., Storari A., Mignani R. Deficiency in the Screening Process of Fabry Disease: Analysis of Chronic Kidney Patients Not on Dialysis. Front Med. (Lausanne) 2021;8:640876. doi: 10.3389/fmed.2021.640876. - DOI - PMC - PubMed
    1. Castelli V., Stamerra C.A., d’Angelo M., Cimini A., Ferri C. Current and Experimental Therapeutics for Fabry Disease. Clin. Genet. 2021;100:239–247. doi: 10.1111/cge.13999. - DOI - PMC - PubMed
    1. Bichet D.G., Aerts J.M., Auray-Blais C., Maruyama H., Mehta A.B., Skuban N., Krusinska E., Schiffmann R. Assessment of Plasma Lyso-Gb3 for Clinical Monitoring of Treatment Response in Migalastat-Treated Patients with Fabry Disease. Genet. Med. 2021;23:192–201. doi: 10.1038/s41436-020-00968-z. - DOI - PMC - PubMed
    1. Kok K., Zwiers K.C., Boot R.G., Overkleeft H.S., Aerts J.M.F.G., Artola M. Fabry Disease: Molecular Basis, Pathophysiology, Diagnostics and Potential Therapeutic Directions. Biomolecules. 2021;11:271. doi: 10.3390/biom11020271. - DOI - PMC - PubMed
    1. Boggio P., Luna P.C., Abad M.E., Larralde M. Doença de Fabry. An. Bras. Dermatol. 2009;84:367–376. doi: 10.1590/S0365-05962009000400008. - DOI - PubMed

Substances

LinkOut - more resources