

Exploring Serum Biomarkers for Neuropathic Pain in Rat Models of Chemotherapy-Induced Peripheral Neuropathy: A Comparative Pilot Study with Oxaliplatin, Paclitaxel, Bortezomib, and Vincristine
- PMID: 38133405
- PMCID: PMC10747971
- DOI: 10.3390/toxics11121004
Exploring Serum Biomarkers for Neuropathic Pain in Rat Models of Chemotherapy-Induced Peripheral Neuropathy: A Comparative Pilot Study with Oxaliplatin, Paclitaxel, Bortezomib, and Vincristine
Abstract
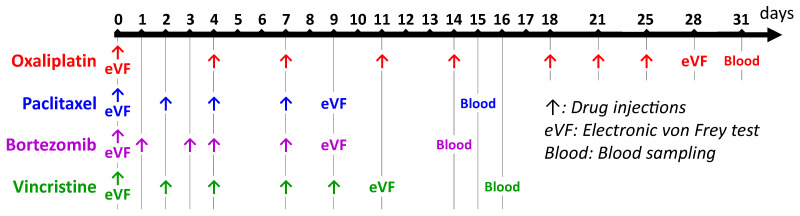
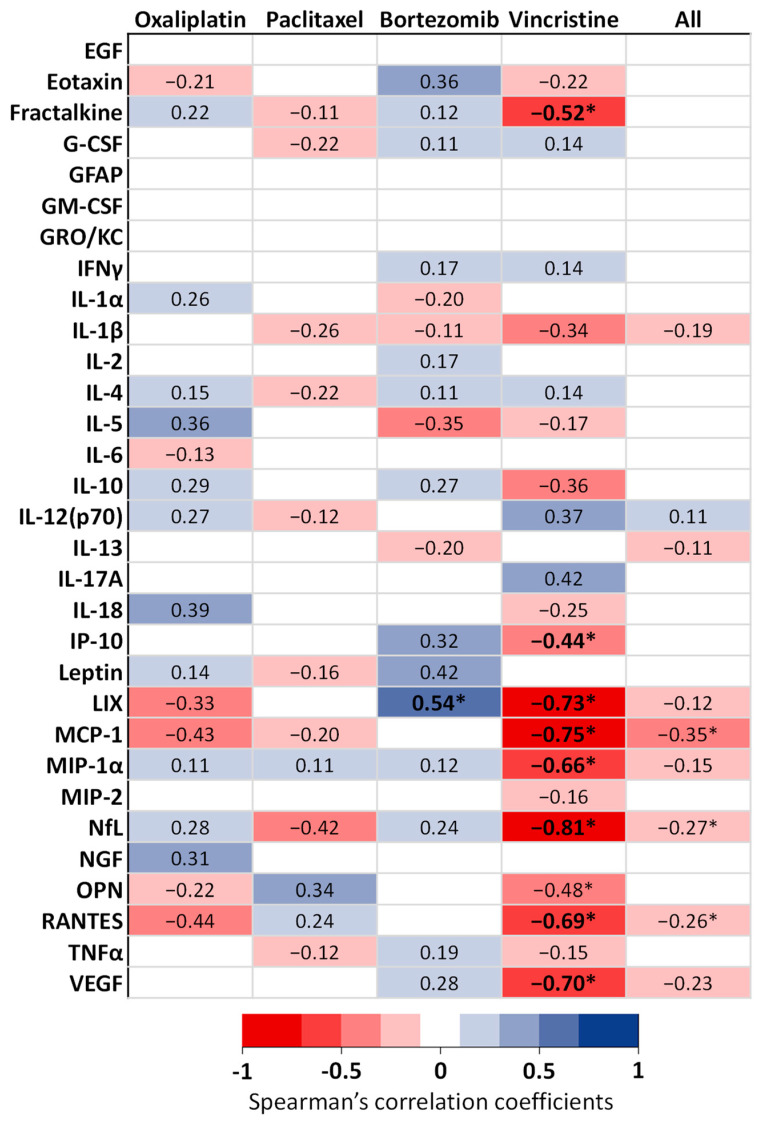
Blood biomarkers, including neurofilament light chain (NfL), have garnered attention as potential indicators for chemotherapy-induced peripheral neuropathy (CIPN), a dose-limiting adverse effect of neurotoxic anticancer drugs. However, no blood biomarker has been established for routine application or translational research. This pilot study aimed to evaluate a limited panel of blood biomarkers in rat models of CIPN and their correlations with neuropathic pain. CIPN models were induced through repeated injections of oxaliplatin, paclitaxel, bortezomib, and vincristine. Electronic von Frey testing was used to assess tactile allodynia. Post anticancer injections, serum concentrations of 31 proteins were measured. Allodynia thresholds decreased in anticancer-treated animals compared to controls. No consistent modifications were observed in the biomarkers across CIPN models. The most noteworthy biomarkers with increased concentrations in at least two CIPN models were NfL (paclitaxel, vincristine), MCP-1, and RANTES (oxaliplatin, vincristine). Vincristine-treated animals exhibited strong correlations between LIX, MCP-1, NfL, and VEGF concentrations and tactile allodynia thresholds. No single biomarker can be recommended as a unique indicator of CIPN-related pain. Because of the study limitations (single dose of each anticancer drug, young animals, and single time measurement of biomarkers), further investigations are necessary to define the kinetics, specificities, and sensitivities of MCP-1, RANTES, and NfL.
Keywords: animal model; blood biomarker; bortezomib; chemotherapy-induced peripheral neuropathy; neuropathic pain; oxaliplatin; paclitaxel; vincristine.
Conflict of interest statement
The authors declare no conflict of interest.
Figures


References
-
- Kerckhove N., Collin A., Condé S., Chaleteix C., Pezet D., Balayssac D. Long-Term Effects, Pathophysiological Mechanisms, and Risk Factors of Chemotherapy-Induced Peripheral Neuropathies: A Comprehensive Literature Review. Front. Pharmacol. 2017;8:86. doi: 10.3389/fphar.2017.00086. - DOI - PMC - PubMed
-
- Selvy M., Pereira B., Kerckhove N., Gonneau C., Feydel G., Pétorin C., Vimal-Baguet A., Melnikov S., Kullab S., Hebbar M., et al. Long-Term Prevalence of Sensory Chemotherapy-Induced Peripheral Neuropathy for 5 Years after Adjuvant FOLFOX Chemotherapy to Treat Colorectal Cancer: A Multicenter Cross-Sectional Study. J. Clin. Med. 2020;9:2400. doi: 10.3390/jcm9082400. - DOI - PMC - PubMed
-
- Selvy M., Kerckhove N., Pereira B., Barreau F., Nguyen D., Busserolles J., Giraudet F., Cabrespine A., Chaleteix C., Soubrier M., et al. Prevalence of Chemotherapy-Induced Peripheral Neuropathy in Multiple Myeloma Patients and Its Impact on Quality of Life: A Single Center Cross-Sectional Study. Front. Pharmacol. 2021;12:637593. doi: 10.3389/fphar.2021.637593. - DOI - PMC - PubMed
-
- Loprinzi C.L., Lacchetti C., Bleeker J., Cavaletti G., Chauhan C., Hertz D.L., Kelley M.R., Lavino A., Lustberg M.B., Paice J.A., et al. Prevention and Management of Chemotherapy-Induced Peripheral Neuropathy in Survivors of Adult Cancers: ASCO Guideline Update. J. Clin. Oncol. Off. J. Am. Soc. Clin. Oncol. 2020;38:3325–3348. doi: 10.1200/JCO.20.01399. - DOI - PubMed
Grants and funding
LinkOut - more resources
Full Text Sources
Miscellaneous
