. 2023 Dec 22;19(12):e1011743.
doi: 10.1371/journal.pcbi.1011743. eCollection 2023 Dec.

Method to determine whether sleep phenotypes are driven by endogenous circadian rhythms or environmental light by combining longitudinal data and personalised mathematical models

Affiliations

Method to determine whether sleep phenotypes are driven by endogenous circadian rhythms or environmental light by combining longitudinal data and personalised mathematical models

Anne C Skeldon et al. PLoS Comput Biol. .

Abstract

Sleep timing varies between individuals and can be altered in mental and physical health conditions. Sleep and circadian sleep phenotypes, including circadian rhythm sleep-wake disorders, may be driven by endogenous physiological processes, exogeneous environmental light exposure along with social constraints and behavioural factors. Identifying the relative contributions of these driving factors to different phenotypes is essential for the design of personalised interventions. The timing of the human sleep-wake cycle has been modelled as an interaction of a relaxation oscillator (the sleep homeostat), a stable limit cycle oscillator with a near 24-hour period (the circadian process), man-made light exposure and the natural light-dark cycle generated by the Earth's rotation. However, these models have rarely been used to quantitatively describe sleep at the individual level. Here, we present a new Homeostatic-Circadian-Light model (HCL) which is simpler, more transparent and more computationally efficient than other available models and is designed to run using longitudinal sleep and light exposure data from wearable sensors. We carry out a systematic sensitivity analysis for all model parameters and discuss parameter identifiability. We demonstrate that individual sleep phenotypes in each of 34 older participants (65-83y) can be described by feeding individual participant light exposure patterns into the model and fitting two parameters that capture individual average sleep duration and timing. The fitted parameters describe endogenous drivers of sleep phenotypes. We then quantify exogenous drivers using a novel metric which encodes the circadian phase dependence of the response to light. Combining endogenous and exogeneous drivers better explains individual mean mid-sleep (adjusted R-squared 0.64) than either driver on its own (adjusted R-squared 0.08 and 0.17 respectively). Critically, our model and analysis highlights that different people exhibiting the same sleep phenotype may have different driving factors and opens the door to personalised interventions to regularize sleep-wake timing that are readily implementable with current digital health technology.


Conflict of interest statement

I have read the journal’s policy and the authors of this manuscript have the following competing interests: DJD and ACS are consultants for F. Hoffmann-La Roche, Ltd.

Figures

Fig 1
Fig 1. Homeostat-Circadian-Light (HCL) model.
Patterns of available environmental light gated by the sleep-wake cycle (since we turn off the lights and close our eyes when we go to sleep), result in a rhythmic signal that passes from the retina to the suprachiasmatic nuclei (SCN). Provided the signal is of sufficient ‘strength’, it controls the timing of rhythms in the SCN, which in turn drives the 24-hour rhythm in the circadian drive for wakefulness and sleep. Homeostatic sleep pressure H increases during wake and decreases during sleep. If kept awake, homeostatic sleep pressure asymptotes to an asymptote μ. The larger the value of μ, the faster the rise rate of homeostatic sleep pressure during wake. Switching between wake (W) and sleep (S) states occurs at thresholds modulated by the circadian rhythm of wake-sleep propensity [37] which has peak-to-peak amplitude 2ca.
Fig 2
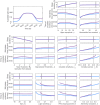
Fig 2. Dependence of model predicted sleep duration and timing on model parameters and light exposure.
The top left panel shows two different light availability profiles. In all other groups of panels, the dependence of sleep duration (top panels), mid-sleep time (middle panels) and time of the circadian minimum (bottom panels) for the two light profiles are shown. The black vertical line indicates the default parameter values. Results are shown for all five sleep-wake parameters and five of the circadian-light parameters. The equivalent graphs for the remaining four circadian-light parameters are shown in Fig D in S1 Appendix.
Fig 3
Fig 3. Example of field data for five different sleep phenotypes and summary information for sleep timing and duration for each participant and the cohort.
Panels (a) show daily sleep timing (coloured horizontal bars, darker colouring shows sleep on Friday and Saturday nights). Light exposure is shown in the background for four different intensity bands. Dusk and dawn are indicated by the orange triangles. Panels (b) show box plots for mid-sleep timing and sleep duration respectively for each participant. Participants have been ordered according to their mean mid-sleep time. Panels (c) show the distributions of mean participant mid-sleep, standard deviation of participant mid-sleep, mean participant sleep duration, and standard deviation of participant sleep duration respectively.
Fig 4
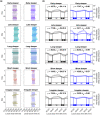
Fig 4. Example fits to mid-sleep and sleep duration.
Panels (a) show simulated raster plots superimposed on the sleep timings (background bars coloured according to phenotype) as a result of fitting for the homeostatic parameter μ with the two alternative circadian timing parameters, i.e. the intrinsic circadian period, τc (grey, left hand column), and the circadian amplitude ca (blue, right hand column). Panels (b) show the corresponding Homeostatic-Circadian-Light (HCL) models from fitting for (μ, τc) (grey, left hand column, ca fixed at the default value of 1.72) and for (μ, ca) (blue, right hand column, τc fixed at the default value of 24.20 h).
Fig 5
Fig 5. Associations between the fitted homeostatic parameter μ with the two alternative circadian timing parameters, i.e. the intrinsic circadian period, τc and the circadian amplitude ca.
Fig 6
Fig 6. Identifiability of model parameters.
Panels (a) show histograms of fitted intrinsic circadian period τc for three different choices of the circadian amplitude ca, highlighting the inter-dependence of these two parameters. Panels (b) show the residual for fitting simultaneously to mean sleep duration and mean mid-sleep timing for one participant as a function of (μ, τc) and (μ, ca) i.e. the sum of the squared differences between mean sleep duration and mean simulated sleep duration and mean mid-sleep time and mean simulated mid-sleep time.
Fig 7
Fig 7. Example light data for five different sleep phenotypes and summary information for each participant and the cohort.
Panels (a) show examples of light exposure patterns for five different participants. The regions show the fraction of time spent in each of four intensity bands. Average sleep timing is marked by the coloured horizontal bars. Dusk and dawn are indicated by the orange triangles. Panels (b) show box plots for the daily hours of bright light and the daily measure of the effect of light on the circadian clock respectively for each participant. Participants are ordered by their mean mid-sleep time, as in Fig 3. Panels (c) show the distributions of the mean and standard deviation of participant daily hours of bright light and the mean and standard deviation of the participant daily measure of the effect of light on the biological clock.
Fig 8
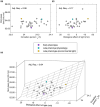
Fig 8. Quantifying the effect of environment versus physiology in the determination of mid-sleep time.
Panel (a) shows that the fitted physiologically-motivated timing parameter, the intrinsic circadian period τc, also only explains a small amount of the between participant variance. Similarly, panel (b) shows that considering the novel metric of the biological effect of light also explains only a small amount of the between participant mid-sleep time. In contrast, combining environmental and physiological variables (panel (c)), explains a large amount of the variance.
Fig 9
Fig 9. Effect of light interventions.
The upper panels show one day of the original time series of the recorded light. The available light for the evening and the morning light intervention are shown in red / blue respectively. The bottom panels show the predicted sleep timing for each of the three cases (black, default; red, evening light reduction; blue, morning light enhancement). Predicted sleep timing is the average over a two week period starting two weeks after the beginning of the intervention.

References

    1. The Lancet. Waking up to the importance of sleep. The Lancet. 2022;400:973. doi: 10.1016/S0140-6736(22)01774-3 - DOI - PubMed
    1. Meyer N, Harvey AG, Lockley SW, Dijk D-J. Circadian rhythms and disorders of the timing of sleep. The Lancet. 2022;400:1061–1078. doi: 10.1016/S0140-6736(22)00877-7 - DOI - PubMed
    1. Walker 2nd WH, Walton JC, DeVries AC, Nelson RJ. Circadian rhythm disruption and mental health. Transl Psychiatry. 2020;10:28. doi: 10.1038/s41398-020-0694-0 - DOI - PMC - PubMed
    1. Logan RW, McClung CA. Rhythms of life: circadian disruption and brain disorders across the lifespan. Nat Rev Neurosci. 2019;20:49–65. doi: 10.1038/s41583-018-0088-y - DOI - PMC - PubMed
    1. Katori M, Shi S, Ode KL, Tomita Y, Ueda HR. The 103,200-arm acceleration dataset in the UK Biobank revealed a landscape of human sleep phenotypes. Proc Natl Acad Sci. 2022;119:e2116729119. doi: 10.1073/pnas.2116729119 - DOI - PMC - PubMed