. 2024 Jan;55(1):31-39.
doi: 10.1161/STROKEAHA.123.044083. Epub 2023 Dec 22.

Trial Readiness of Cavernous Malformations With Symptomatic Hemorrhage, Part II: Biomarkers and Trial Modeling

Affiliations

Trial Readiness of Cavernous Malformations With Symptomatic Hemorrhage, Part II: Biomarkers and Trial Modeling

Stephanie Hage et al. Stroke. 2024 Jan.

Abstract

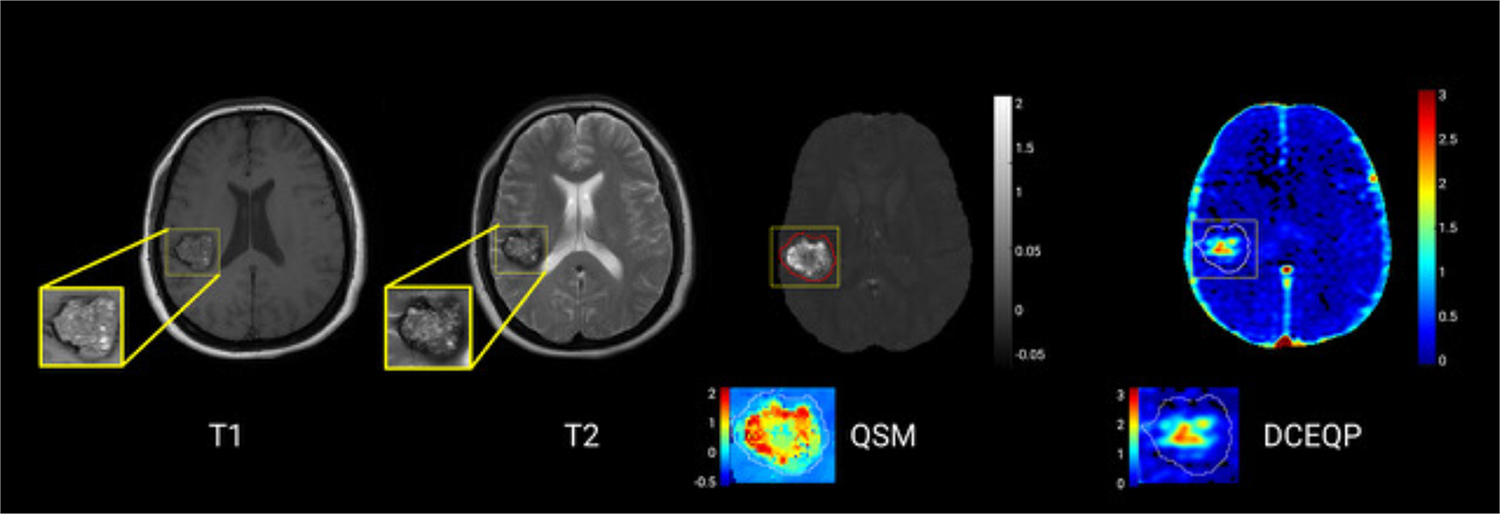
Background: Quantitative susceptibility mapping (QSM) and dynamic contrast-enhanced quantitative perfusion (DCEQP) magnetic resonance imaging sequences assessing iron deposition and vascular permeability were previously correlated with new hemorrhage in cerebral cavernous malformations. We assessed their prospective changes in a multisite trial-readiness project.

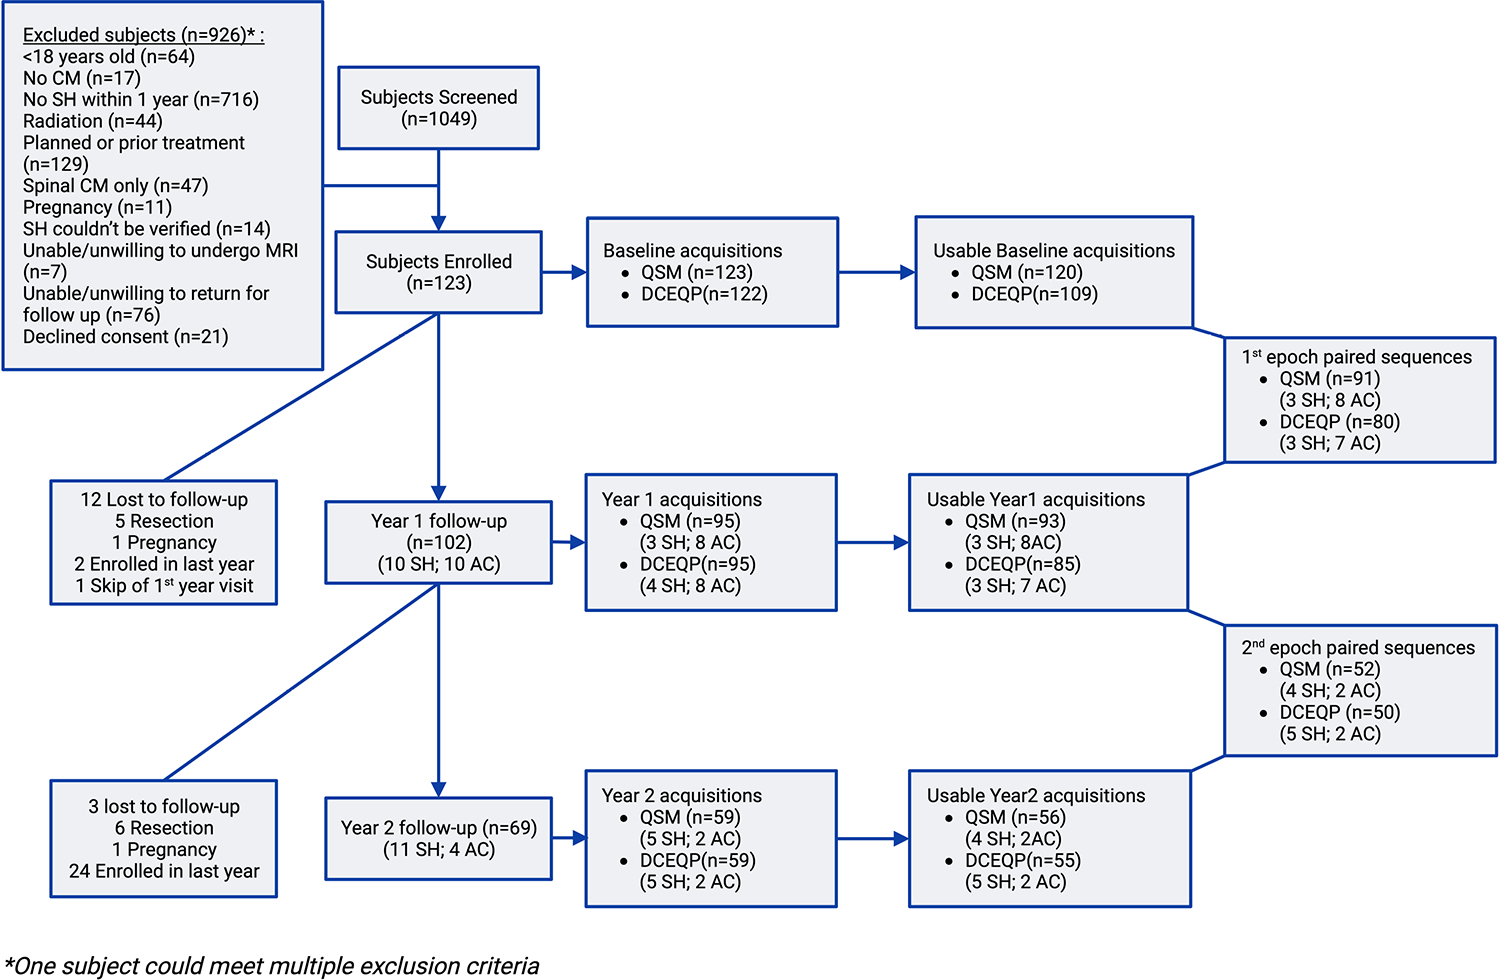
Methods: Patients with cavernous malformation and symptomatic hemorrhage (SH) in the prior year, without prior or planned lesion resection or irradiation were enrolled. Mean QSM and DCEQP of the SH lesion were acquired at baseline and at 1- and 2-year follow-ups. Sensitivity and specificity of biomarker changes were analyzed in relation to predefined criteria for recurrent SH or asymptomatic change. Sample size calculations for hypothesized therapeutic effects were conducted.

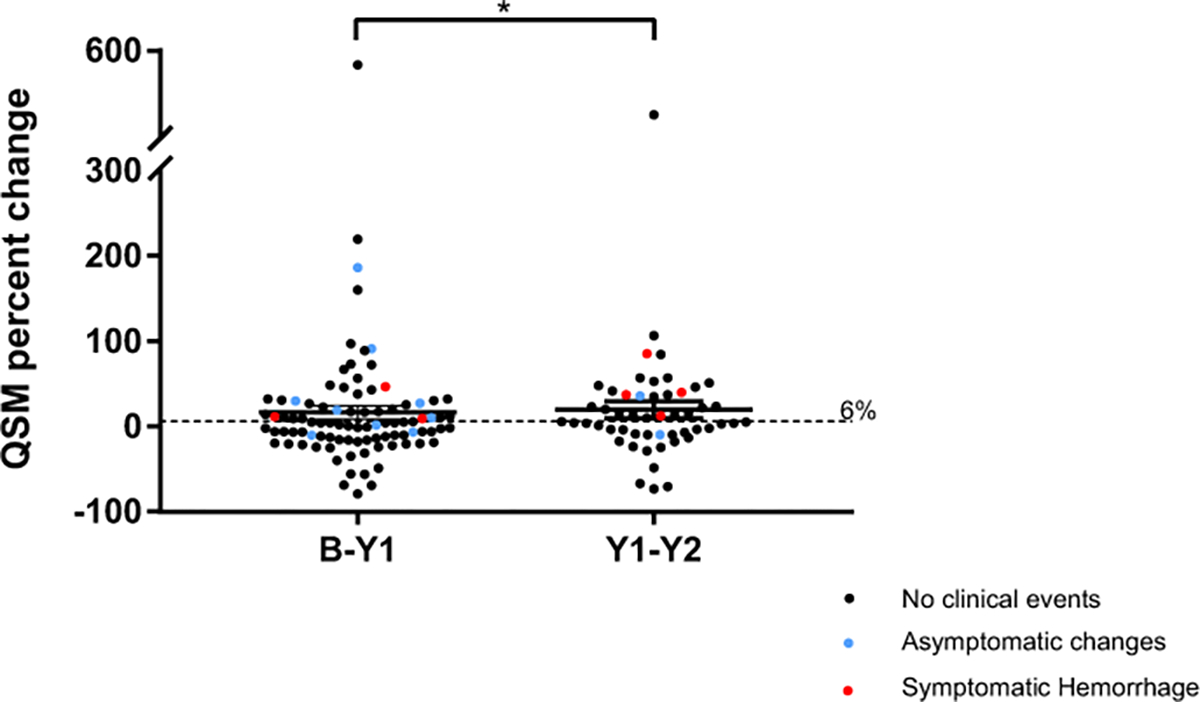
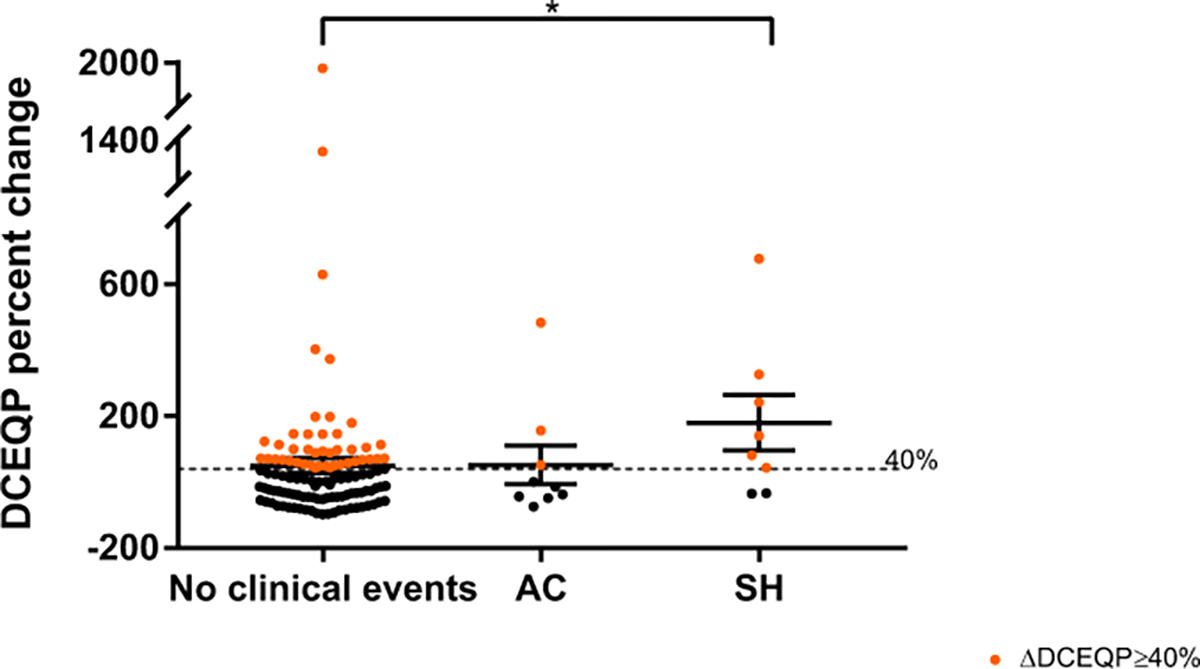
Results: We logged 143 QSM and 130 DCEQP paired annual assessments. Annual QSM change was greater in cases with SH than in cases without SH (P=0.019). Annual QSM increase by ≥6% occurred in 7 of 7 cases (100%) with recurrent SH and in 7 of 10 cases (70%) with asymptomatic change during the same epoch and 3.82× more frequently than clinical events. DCEQP change had lower sensitivity for SH and asymptomatic change than QSM change and greater variance. A trial with the smallest sample size would detect a 30% difference in QSM annual change during 2 years of follow-up in 34 or 42 subjects (1 and 2 tailed, respectively); power, 0.8, α=0.05.

Conclusions: Assessment of QSM change is feasible and sensitive to recurrent bleeding in cavernous malformations. Evaluation of an intervention on QSM percent change may be used as a time-averaged difference between 2 arms using a repeated measures analysis. DCEQP change is associated with lesser sensitivity and higher variability than QSM. These results are the basis of an application for certification by the US Food and Drug Administration of QSM as a biomarker of drug effect on bleeding in cavernous malformations.

Registration: URL: https://www.clinicaltrials.gov; Unique identifier: NCT03652181.

Keywords: biomarkers; hemorrhage; iron; perfusion; permeability.


Conflict of interest statement

Disclosures Dr Awad is a consultant and Dr Kim oversees data and safety monitoring board for Neurelis, Inc. Dr Awad reports compensation from Medicoegal consulting for expert witness services. S. Kinkade reports employment by UChicago. Drs Kim and Flemming are consultants for Recursion Pharmaceuticals. Dr Huang is the Director for the American Board of Neurological Surgery; reports compensation by Longevity Neuro Solutions; reports employment by School of Medicine, Johns Hopkins University; and reports other intellectual property for Fundamentals of Operative Neurosurgery. Dr Hutson is a stockholder in Navinetics and Resoundant; reports grants from Batterman Family Foundation; reports compensation from Eisai, Inc; and reports a provisional patent for Brain MR Elastography licensed to Mayo Clinic. Dr Lupo has a grant from GE Healthcare. Dr Mabray is employed by Mind Research Network and is a consultant for Smart Soft Healthcare. K. Lane and Dr Hanley report funding from the National Institute of Neurological Disorders and Stroke. N. Ostapkovich reports employment by Johns Hopkins University. Dr Koenig is employed by the National Institutes of Health (NIH). This report does not represent the official view of the NIH or any part of the US Federal Government, and no official support or endorsement of this article by the NIH is intended or should be inferred. The other authors report no conflicts.

Figures

Figure 1.
Figure 1.
Illustration of conventional MRI axial images with (left to right) T1-weighted sequence, T2-weighted sequence, QSM, and DCEQP assessments of CM lesion with SH. The regions of interest for QSM and DCQEP assessments include the whole lesion as delineated on T2-weighted sequence. Note the maximal QSM values in the hemosiderin ring at the lesion periphery, while the maximal permeability values are within the core of the lesion.
Figure 2.
Figure 2.
Flow chart of screened, excluded and enrolled subjects with yearly follow-up and contribution to research imaging acquisitions, usability and QSM/DCEQP pairs analyzed.
Figure 3.
Figure 3.
QSM percent change during the 1st and 2nd follow-up years. QSM yearly-change during epoch 1 (mean +16.33; SD 74.93) was significantly lower (p=0.033) than in epoch 2 (mean +19.61; SD 70.96). Red dots represent SH; blue dots represent AC; and black dots represent no clinical event detected.
Figure 4.
Figure 4.
QSM yearly percent change for cases with SH, AC and no clinical events detected during the same epoch as paired biomarker assessment. No significant differences in percent yearly-change in mean lesional QSM between cases with SH (mean +34.64; SD 27.17) and AC (mean +38.53; SD 59.36) during the same epoch. QSM changes with SH events were significantly higher than QSM change in cases with no clinical events (p 0.019). Red dots represent QSM pairs that meet the threshold biomarker ΔQSM ≥6%.
Figure 5.
Figure 5.
DCEQP percent change during the 1st and 2nd follow-up years. DCEQP yearly-change during the epoch 1 (mean +61.62; SD +248.8) was not significantly different from the change during epoch 2 (mean +52.45; SD +206.4). Red dots represent SH; blue dots represent AC; and black dots represent no clinical event detected.
Figure 6.
Figure 6.
DCEQP yearly percent change for SH, AC and no clinical events detected during the same epoch as paired biomarker assessment. There was significantly higher percent change in mean lesional DCEQOP (mean +179.9; SD +237.4) in cases with SH events than in those without detected clinical events (mean +49.92; SD +235.5) (p 0.030). No significant difference in yearly DCEQP change between AC events (mean +52.45; SD +175.8) and either SH events or cases with no clinical events. Orange dots represent DCEQP pairs that meet the threshold biomarker ΔDCEQP ≥40%.

References

    1. Horne MA, Flemming KD, Su IC, Stapf C, Jeon JP, Li D, Maxwell SS, White P, Christianson TJ, Agid R, et al. Clinical course of untreated cerebral cavernous malformations: a meta-analysis of individual patient data. Lancet Neurol. 2016;15:166–173. - PMC - PubMed
    1. Carrión-Penagos J, Zeineddine HA, Polster SP, Girard R, Lyne SB, Koskimäki J, Romanos S, Srinath A, Zhang D, Cao Y, et al. Subclinical imaging changes in cerebral cavernous angiomas during prospective surveillance. J Neurosurg. 2020;134:1147–1154. - PMC - PubMed
    1. Snellings DA, Hong CC, Ren AA, Lopez-Ramirez MA, Girard R, Srinath A, Marchuk DA, Ginsberg MH, Awad IA, Kahn ML. Cerebral Cavernous Malformation: From Mechanism to Therapy. Circ Res. 2021;129:195–215. - PMC - PubMed
    1. McKerracher L, Shenkar R, Abbinanti M, Cao Y, Peiper A, Liao JK, Lightle R, Moore T, Hobson N, Gallione C, et al. A Brain-Targeted Orally Available ROCK2 Inhibitor Benefits Mild and Aggressive Cavernous Angioma Disease. Transl Stroke Res. 2020;11:365–376. - PMC - PubMed
    1. Shenkar R, Peiper A, Pardo H, Moore T, Lightle R, Girard R, Hobson N, Polster SP, Koskimäki J, Zhang D, et al. Rho Kinase Inhibition Blunts Lesion Development and Hemorrhage in Murine Models of Aggressive Pdcd10/Ccm3 Disease. Stroke. 2019;50:738–744. - PMC - PubMed

MeSH terms

Associated data