. 2023 Dec 22;9(51):eadh1442.
doi: 10.1126/sciadv.adh1442. Epub 2023 Dec 22.

Chromosome 8p engineering reveals increased metastatic potential targetable by patient-specific synthetic lethality in liver cancer

Affiliations

Chromosome 8p engineering reveals increased metastatic potential targetable by patient-specific synthetic lethality in liver cancer

Thorben Huth et al. Sci Adv. .

Abstract

Large-scale chromosomal aberrations are prevalent in human cancer, but their function remains poorly understood. We established chromosome-engineered hepatocellular carcinoma cell lines using CRISPR-Cas9 genome editing. A 33-mega-base pair region on chromosome 8p (chr8p) was heterozygously deleted, mimicking a frequently observed chromosomal deletion. Using this isogenic model system, we delineated the functional consequences of chr8p loss and its impact on metastatic behavior and patient survival. We found that metastasis-associated genes on chr8p act in concert to induce an aggressive and invasive phenotype characteristic for chr8p-deleted tumors. Genome-wide CRISPR-Cas9 viability screening in isogenic chr8p-deleted cells served as a powerful tool to find previously unidentified synthetic lethal targets and vulnerabilities accompanying patient-specific chromosomal alterations. Using this target identification strategy, we showed that chr8p deletion sensitizes tumor cells to targeting of the reactive oxygen sanitizing enzyme Nudix hydrolase 17. Thus, chromosomal engineering allowed for the identification of novel synthetic lethalities specific to chr8p loss of heterozygosity.


Figures

Fig. 1.
Fig. 1.. chr8pLOH is a frequent event observed in a plethora of cancer entities and associated with poor outcome.
(A) Copy number variation profile of patients with HCC from the TCGA-LIHC cohort visualized by progenetix.org. (B) Frequency of chr8p copy number alterations in different cancer entities. chr8pLOH groups were defined by a mean copy number of <−0.33 in LIHC (HCC), BLCA (bladder urothelial carcinoma), HNSC (head and neck squamous cell carcinoma), LUAD (lung adenocarcinoma), CHOL (cholangiocarcinoma), PRAD (prostate adenocarcinoma), BRCA (breast invasive carcinoma), and COAD (colon adenocarcinoma). (C) Kaplan-Meier survival curves of patients with TCGA-LIHC and (D) LICA-FR clustered into chr8p wild-type (WT) [red; N = 117 (C) and N = 52 (D)] or chr8pLOH [blue; N = 227 (C) and N = 100 (D)] according to mean copy number. Hazard ratio (HR) with 95% confidence interval and P values were calculated by log-rank test. (E) Mutation, copy number, and gene expression data of chr8 in the TCGA-LIHC cohort. Numbers of missense and nonsense mutations per gene are shown. Genes on chr8p are colored in blue, and those on chr8q are colored in red (top). Clustered heatmap visualization of copy number variation on chr8. Deletions are colored in blue, and amplifications are colored in red (center). Visualization of z-scores of chr8 gene expression (bottom). (F) Gene essentiality scores for chr8p (blue) and chr8q genes (red) in liver cancer cell lines (top) or in solid tumor cell lines (pan-cancer; bottom) obtained from Broad Institute’s DepMap database. Only genes with positive gene essentiality scores are depicted. Quantification of genes with essentiality scores of >0.2 per Mbp.
Fig. 2.
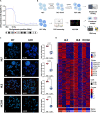
Fig. 2.. Engineering of chr8p loss in HCC cells by CRISPR-Cas9 technology and validation of chr8pLOH-harboring clones.
(A) Shifting window plot for percentage of LOH at different genomic locations on chr8. The 2- and 35-Mbp cut sites are indicated by dotted vertical lines with chr8pLOH of >60%. (B) Workflow for engineering and validation of chr8pLOH cell lines. Images were created with biorender.com. (C) FISH of metaphase chr8pWT and chr8pLOH cell clones staining the 8p21 region (red) and the whole chr8p arm (green) together with 4′,6-diamidino-2-phenylindole (DAPI) (blue). Ratio of chr8p allele lengths for 5 to 10 single cells is represented as means ± SD with each dot representing one cell. Student’s t test was performed to determine P values. (D) Heatmap of relative gene expression of chr8 genes in chr8pWT and chr8pLOH clones determined by RNA-seq. z-scores for comparisons in each cell line are shown.
Fig. 3.
Fig. 3.. Heterozygous loss of chr8p alters genome-wide RNA expression and affects metastasis-associated pathways.
(A) Log fold change (logFC) of genome-wide RNA expression in HLF clones determined by RNA-seq. chr8p genes are indicated in blue, and chr8q genes are indicated in red. Dotted vertical lines indicate a logFC of ±0.5 and the dotted horizontal line indicates the P value of 0.05 as determined by limma analysis. (B) Gene set enrichment analysis of chr8pLOH compared to chr8pWT clones. KEGG pathway analysis was performed for HLF and HCC68 clones individually. Pathways significantly deregulated in both cell lines are shown. (C) Ingenuity Pathway Analysis was performed for paired HLF clones, paired HCC68 clones, and TCGA-LIHC and LICA-FR dataset grouped by chr8pLOH and chr8pWT according to copy numbers. Only pathways significantly deregulated in all four comparisons are shown. P values are depicted as bubble size, and z-scores for pathway activation or inhibition were calculated. IL-15, interleukin-15.
Fig. 4.
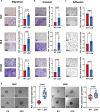
Fig. 4.. Heterozygous loss of chr8p results in a metastatic phenotype in vitro.
(A) Transwell migration and (B) transwell invasion assays with quantification of migrated or invaded cell area in HLF, HLE, and HCC68 cell clones. Exemplary 10× microscopy images of transwells are shown [chr8pWT (top) and chr8pLOH (bottom)]. Data are represented as means ± SD of five independent experiments. (C) Cell adhesion assay and quantification of adhered cell area 1 hour after seeding in HLF, HLE, and HCC68 cell clones. Exemplary 4× microscopy images are shown [chr8pWT (top) and chr8pLOH (bottom)]. Data are represented as means ± SD of four independent experiments. (D) Spheroid sprouting through a collagen matrix of chr8pWT and chr8pLOH clones in HLF and HLE cells. Spheroid perimeter quantification for 20 to 30 single spheroids is represented as means ± SD of three independent experiments each dot representing one spheroid. Exemplary spheroid images are shown 0 and 24 hours after seeding. Student’s t test was performed to determine P values [P >0.05, not significant (ns)].
Fig. 5.
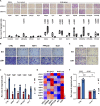
Fig. 5.. Several metastasis suppressor gene candidates are located on chr8p.
(A) RNAi migration screen of chr8p candidate metastasis suppressors in HLF cells. Exemplary transwell migration images (top) are shown with respective quantification (bottom) of cell migration from four independent experiments. Knockdown was performed with two different siRNAs targeting each gene and quantified relative to Allstar and siGFP control (siRNA #1, light gray; siRNA #2, dark gray). Data are shown as floating bars with the line indicating median and single dots representing replicates of four independent experiments. (B) Representative images of transwell migration assay in chr8pWT or chr8pLOH HLF cells after transfection with empty vector (CTRL) or target gene overexpression vectors (MSRA-HA, NAT1-HA, PPP2CB-HA, DLC1-V5). (C) Quantification of transwell migration in chr8pWT and chr8pLOH HLF cells after gene overexpression. Data are represented as means ± SD of three independent experiments shown by single dots. (D) Heatmap of metastasis-associated gene expression after siRNA-mediated target gene knockdown in HLF cells compared to Allstar control [real-time quantitative PCR (RT-qPCR) data] and of chr8pWT and chr8pLOH HLF cells (RNA-seq data). z-scores are shown for gene expression relative to Allstar control (RT-qPCR) and relative to mean gene expression (RNA-seq). (E) Representative transwell migration images in chr8pWT and chr8pLOH HLF cells after transfection with empty vector (CTRL) or all four candidate genes simultaneously. (F) Quantification of transwell migration in chr8pWT and chr8pLOH HLF cells after gene overexpression. Data are represented as means ± SD of four independent experiments shown by single dots. Two-way analysis of variance (ANOVA) was performed for comparison of multiple groups. P values are indicated above the graphs (P > 0.05, ns).
Fig. 6.
Fig. 6.. Identification of NUDT17 as chr8pLOH-specific vulnerability by genome-wide CRISPR-Cas9 knockout screen.
(A) Schematic outline of the synthetic lethal CRISPR knockout screen performed in triplicates in chr8pWT and chr8pLOH HLF cells. (B) Representation of CRISPR screening results depicting essentiality scores in chr8pWT and chr8pLOH cells for each single gene. Significant (waldFDR < 0.05) genes enriched in WT cells are colored green and considered as selectively essential for chr8pLOH cells. (C) Venn diagram of selectively essential genes in chr8pLOH cells according to CRISPR knockout screen and DepMap analyses. (D) Normalized sgNUDT17 read counts in chr8pWT (red) and chr8pLOH (blue) cells at days 0 and 14. (E) NUDT17 gene expression in TCGA-LIHC for normal liver (NT) and HCC (T) samples. (F) Kaplan-Meier survival curves of patients with TCGA-LIHC with high (red; N = 185) or low (blue; N = 184) NUDT17 gene expression. HR with 95% confidence interval and P values were calculated by log-rank test. (G) NUDT17 knockout efficiency of two independent sgRNAs determined by interference of CRISPR-edits (ICE) analysis in three independent experiments. (H) Growth curve for HLF chr8pWT and chr8pLOH cells after transduction with nontargeting sgRNA (NTsgRNA) or two independent sgRNAs targeting NUDT17 and cell viability measurement in relative fluorescence units (RFU). Of four independent experiments, one representative growth curve is shown. Data are represented as means ± SD of technical triplicates. (I) Relative cell viability after 96 hours of chr8pWT and chr8pLOH cells following NUDT17 knockout. (J) Representative colony formation and (K) quantification of colony formation area of chr8pWT and chr8pLOH HLF cells stained after 14 days. UT, untreated. Data are represented as means ± SD of four independent experiments with each dot representing the mean of one experiment. Two-way ANOVA was performed for comparison of multiple groups. P values are indicated above the graphs (P > 0.05, ns).
Fig. 7.
Fig. 7.. NUDT17 and the chr8p gene NUDT18 are synthetic lethal paralogs.
(A) NUDT18 (left) and NUDT17 (right) gene expression in TCGA-LIHC and (B) LICA-FR for chr8pWT and chr8pLOH samples. (C) NUDT18 knockout efficiency of two independent sgRNAs determined by ICE analysis of three independent experiments. (D) Growth curves and cell viability quantification and (E) Colony formation assay for chr8pWT HLF or (F and G) HCC68 cells after transduction with NTsgRNA, sgNUDT17, sgNUDT18, or combinations of both (1:1 ratio). Measurements of two independent sgRNAs for single NUDT17 or NUDT18 knockout were combined. The combination is depicted as mean of four different sgRNA combinations. Of four independent replicates, one representative growth curve is shown with data representation as means ± SD of technical triplicates. Quantification is shown as means ± SD of four independent experiments with each dot representing one sgRNA or sgRNA combination after 96 hours (HCC68) or 168 hours (HLF). Representative colony formation images are shown 14 days after single or double knockout. Quantification data are represented as mean colony area ± SD of four independent experiments with each dot representing a sgRNA or combination of one experiment. (H) Colony formation rescue assays in chr8pLOH HLF or (I) HCC68 cells expressing NUDT18 upon doxycycline induction and transfected with siPools targeting NUDT17. Quantification is shown as mean colony area ± SD of four independent experiments with each dot representing a single experiment 14 days after seeding. Representative images of four replicates are shown. Two-way ANOVA was performed for comparison of multiple groups. P values are indicated above the graphs (P > 0.05, ns).
Fig. 8.
Fig. 8.. Concomitant NUDT17/18 loss leads to cell cycle arrest.
(A) Heatmap depicting log fold gene expression of the most prominently altered genes after pooled siRNA-mediated knockdown of NUDT17 and NUDT18 as determined by RNA-seq in HLF cells. (B) KEGG gene set enrichment analysis of NUDT17, NUDT18, or combinatory knockdowns relative to control transfected HLF cells. Pathways significantly deregulated after double knockdown are shown. ER, endoplasmic reticulum. (C) RT-qPCR validation of cell cycle–associated gene expression in HCC68 cells. (D) β-Galactosidase staining of HLF cells after knockdown of NUDT17 and NUDT18. Exemplary images with senescent cells visualized in blue. Quantification of relative stained area is depicted as box whisker plots with each dot representing one image of three independent experiments (E) Cell distribution in G1, S, and G2 cell cycle phases after dual knockdown untreated (UT) or treated with 5 μM H2O2 was analyzed by flow cytometric measurements of EdU-incorporating proliferative cells and FxCycle-FarRed DNA staining. (F) Immunofluorescence images of HLF cells after single or dual knockout and treatment with 10 μM H2O2. Nuclei were stained with DAPI in blue and cytosolic 8oxo–2′-deoxyguanosine 5′-triphosphate (dGTP) levels are shown in green. Knockout was performed with two independent sgRNAs for both genes. Exemplary images are shown for each condition. (G) Quantification of relative intensity of 8oxo-dGTP immunofluorescence. Data are represented as box whisker plots with each dot representing one single cell of three to six independent experiments. Image analysis was performed using Fiji software. Two-way ANOVA was performed for comparison of multiple groups. P values are indicated above the graphs (P >0.05, ns).
Fig. 9.
Fig. 9.. NUDT17 and NUDT18 are synthetic lethal paralogs affecting ROS response.
(A) Illustration on NUDT17 dependency in cells harboring chr8pLOH. Loss of NUDT18 in chr8pLOH increases dependency on its paralog NUDT17. (B) Reduced levels of NUDT18 in cells with chr8pLOH create NUDT17 dependency. Upon NUDT17 ablation, chr8pLOH cells are prone to DNA damage by ROS leading to impaired cell viability and cell cycle arrest, whereas chr8pWT cells remain unaffected.

References

    1. D. Hanahan, Hallmarks of cancer: New dimensions. Cancer Discov. 12, 31–46 (2022). - PubMed
    1. A. M. Taylor, J. Shih, G. Ha, G. F. Gao, X. Zhang, A. C. Berger, S. E. Schumacher, C. Wang, H. Hu, J. Liu, A. J. Lazar; The Cancer Genome Atlas Research Network, A. D. Cherniack, R. Beroukhim, M. Meyerson, Genomic and functional approaches to understanding cancer aneuploidy. Cancer Cell 33, 676–689 e3 (2018). - PMC - PubMed
    1. R. Beroukhim, C. H. Mermel, D. Porter, G. Wei, S. Raychaudhuri, J. Donovan, J. Barretina, J. S. Boehm, J. Dobson, M. Urashima, K. T. Mc Henry, R. M. Pinchback, A. H. Ligon, Y. J. Cho, L. Haery, H. Greulich, M. Reich, W. Winckler, M. S. Lawrence, B. A. Weir, K. E. Tanaka, D. Y. Chiang, A. J. Bass, A. Loo, C. Hoffman, J. Prensner, T. Liefeld, Q. Gao, D. Yecies, S. Signoretti, E. Maher, F. J. Kaye, H. Sasaki, J. E. Tepper, J. A. Fletcher, J. Tabernero, J. Baselga, M. S. Tsao, F. Demichelis, M. A. Rubin, P. A. Janne, M. J. Daly, C. Nucera, R. L. Levine, B. L. Ebert, S. Gabriel, A. K. Rustgi, C. R. Antonescu, M. Ladanyi, A. Letai, L. A. Garraway, M. Loda, D. G. Beer, L. D. True, A. Okamoto, S. L. Pomeroy, S. Singer, T. R. Golub, E. S. Lander, G. Getz, W. R. Sellers, M. Meyerson, The landscape of somatic copy-number alteration across human cancers. Nature 463, 899–905 (2010). - PMC - PubMed
    1. D. F. Tschaharganeh, B. Bosbach, S. W. Lowe, Coordinated tumor suppression by chromosome 8p. Cancer Cell 29, 617–619 (2016). - PMC - PubMed
    1. K. L. Gorringe, M. Ramakrishna, L. H. Williams, A. Sridhar, S. E. Boyle, J. L. Bearfoot, J. Li, M. S. Anglesio, I. G. Campbell, Are there any more ovarian tumor suppressor genes? A new perspective using ultra high-resolution copy number and loss of heterozygosity analysis. Genes Chromosomes Cancer 48, 931–942 (2009). - PubMed

Publication types