. 2023 Dec 21;186(26):5766-5783.e25.
doi: 10.1016/j.cell.2023.11.028.

LRRC37B is a human modifier of voltage-gated sodium channels and axon excitability in cortical neurons

Affiliations

LRRC37B is a human modifier of voltage-gated sodium channels and axon excitability in cortical neurons

Baptiste Libé-Philippot et al. Cell. .

Abstract

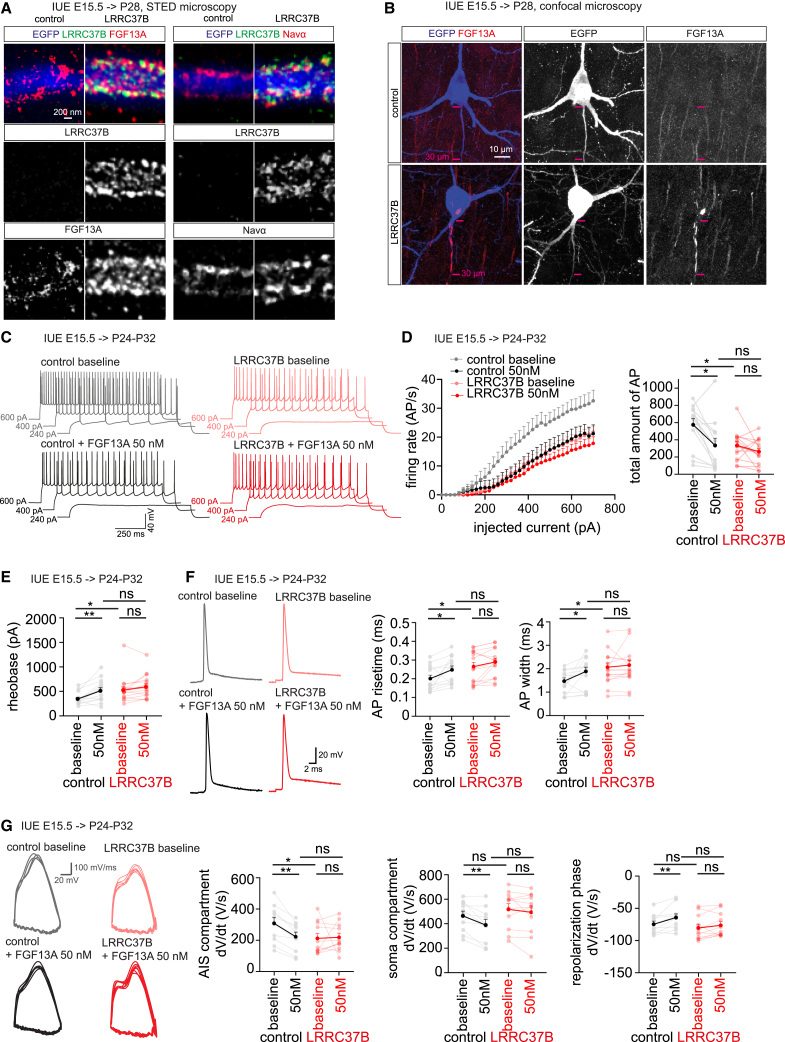
The enhanced cognitive abilities characterizing the human species result from specialized features of neurons and circuits. Here, we report that the hominid-specific gene LRRC37B encodes a receptor expressed in human cortical pyramidal neurons (CPNs) and selectively localized to the axon initial segment (AIS), the subcellular compartment triggering action potentials. Ectopic expression of LRRC37B in mouse CPNs in vivo leads to reduced intrinsic excitability, a distinctive feature of some classes of human CPNs. Molecularly, LRRC37B binds to the secreted ligand FGF13A and to the voltage-gated sodium channel (Nav) β-subunit SCN1B. LRRC37B concentrates inhibitory effects of FGF13A on Nav channel function, thereby reducing excitability, specifically at the AIS level. Electrophysiological recordings in adult human cortical slices reveal lower neuronal excitability in human CPNs expressing LRRC37B. LRRC37B thus acts as a species-specific modifier of human neuron excitability, linking human genome and cell evolution, with important implications for human brain function and diseases.

Keywords: FGF13; LRRC37; SCN1B; axon initial segment; cerebral cortex; gene duplicates; human brain evolution; neuronal excitability; voltage-gated channels.


Conflict of interest statement

Declaration of interests B.L.-P., P.V., J.d.W., A.L., K.W., J.S., F.R., N.L, and K.K. are inventors on a PCT application related to this work.

Figures

None
Graphical abstract
Figure 1
Figure 1
LRRC37 gene family evolution and expression in the cerebral cortex (A) LRRC37 genes in mouse, macaque, and hominids. (B) Protein structure of human LRRC37 proteins (LRRs, leucine-rich repeats; dashed lines indicate positions of aligned protein sequences; note the presence of a LRRC37B specific “LB domain”). (C) Expression of LRRC37 transcripts from scRNA-seq from human MTG. (D) LRRC37 expression (snRNA-seq) from human and chimpanzee dLPFC; CPNs, green; GABAergic neurons, purple; non-neuronal cells, brown. (E) Expression of LRRC37A, LRRC37A2, and LRRC37B in upper-layer CPNs (expression in logCPM, log counts per million; median ± quartiles; Deseq2 test with pseudo-bulk approach; adjusted p value: ∗∗p < 0.01, ∗∗∗∗∗p < 10−7). (F and G) Immunofluorescence of LRRC37B (G, arrows for LRRC37B+ neurons) and ankyrin-G (a marker for the axon initial segment [AIS]) in the human cerebral cortex (upper layer, temporal cortex vibratome section, 22 years old). (H) Immunofluorescence on cryosections of LRRC37B and ankyrin-G in upper layers of mouse barrel cortex (postnatal day 28, P28), and of temporal cortex from 4-year-old macaque, 18-year-old chimpanzee, and 16-year-old human. (I) Proportion of CPNs positive for LRRC37B at the AIS from neonates to 62 years old (n = 25 cases). (J) Schematic summary: LRRC37B is localized to the AIS specifically in human. See also Figure S1, Figure S2.
Figure S1
Figure S1
Structure and expression of LRRC37B in the human cerebral cortex, related to Figure 1 (A) Percentage of similarity of amino acid sequence between human and hominid LRRC37B orthologs as well as macaque LRRC37-M2 and human LRRC37A paralog. (B) Structure of simian LRRC37B-type proteins. (C) Copy numbers of LRRC37 encoding genes in modern human populations (EUR, European; EAST, East Asian; SAS, South Asian; AMR, American; AFR, African; subpopulations defined by the 1000 Genome Project) (published in Byrska-Bishop et al.91). (D) Temporal expression (logCPM) of LRRC37 genes in the human prefrontal cortex from neonates to 40 years old (published in Herring et al.51). (E) LRRC37 transcripts detection in human cortical cells (from Allen Brain Map, Human MTG 10× SEA-AD dataset published in Hodge et al.35). (F) Immunofluorescent detection of ankyrin-G and Nav1.6 (markers of nodes of Ranvier) and LRRC37B in the cortical white matter of a 54-year-old individual.
Figure S2
Figure S2
LRRC37B expression in the mammalian cerebral cortex, related to Figure 1 (A) LRRC37 transcripts detected by bulk RNA-seq in the cerebral cortex in mouse, macaque, and human (expression in RPKM, reads per kilobase million; median + SE median; from Cardoso-Moreira et al.52). (B) Expression of LRRC37B (complementary to Figures 1D and 1E) in chimpanzee and human cells of the dorsolateral prefrontal cortex (expression in logCPM, log counts per million, median ± quartiles; from Ma et al.48) (pyramidal neuron clusters: L2/3 IT, L3–5 IT1–3, L5 ET, L5–6 NP, L6 CT, L6 IT1–2, L6B; GABAergic neuron clusters: ADARB2 KCNG1, LAMP5 LHX6 and RELN, PVALB and PVALB ChC, SST, SST HGF and NPY, VIP; non-neuronal cells: Astro, Endo, Immune, Micro, OPC, Oligo, PC, RB, SMC, VLMC) (Deseq2 test with pseudo-bulk approach for each cluster; ns, non-significant; adjusted p value < 0.05; ∗∗ adjusted p value < 0.01; ∗∗∗ adjusted p value < 0.001; ∗∗∗∗ adjusted p value < 10−4; ∗∗∗∗∗ adjusted p value < 10−6). (C) Live immunostaining for LRRC37B (see STAR Methods) on HEK293T cells transfected for human, chimpanzee, and macaque LRRC37B as well as human LRRC37A2-HA (single focal plan). (D) Immunostaining after fixation and permeabilization for HA on HEK293T cells transfected for LRRC37A2-HA (single focal plan). (E) Immunofluorescent detection of LRRC37B and ankyrin-G complementary to Figure 1H in cryosections of macaque (1–4 years old), chimpanzee (17–37 years old), and human (16–45 years old) cerebral cortex (see STAR Methods and Table S3).
Figure 2
Figure 2
LRRC37B is sufficient to decrease neuronal excitability at the AIS (A) Immunodetection of LRRC37B (arrows) and ankyrin-G in the mouse cerebral cortex (barrel cortex) after IUE with plasmids driving bicistronic expression of LRRC37B and EGFP (LRRC37B neurons), compared with EGFP only (control neurons). (B) Examples traces of evoked action potential (AP) of LRRC37B and control neurons. (C) Firing rates (mean + SEM) as a function of injected current of LRRC37B neurons (36 neurons from 12 animals from 4 litters) compared with control (18 neurons from 7 animals from 4 litters) with corresponding quantification (line at median, Mann-Whitney test). (D) Rheobase of LRRC37B neurons compared with control neurons (line at median, Mann-Whitney test). (E) Single evoked AP examples and properties of LRRC37B neurons (n = 24 neurons) compared with control neurons (n = 18 neurons) (lines at median, Mann-Whitney tests). (F) Phase plot analysis of single evoked AP of LRRC37B neurons (n = 22 neurons from 11 animals from 4 litters) and control neurons (n = 12 neurons from 5 animals from 4 litters) (lines at median, Mann-Whitney tests) (Method 2). ns, non-significant; p < 0.05; ∗∗p < 0.001; ∗∗∗p < 0.001. See also Figure S3.
Figure S3
Figure S3
Effects of LRRC37B overexpression on functional and synaptic properties of mouse CPNs, related to Figure 2 (A) Immunodetection of LRRC37B and ankyrin-G in the mouse cerebral (barrel) cortex after transfection of EGFP only or bicistronic expression of EGFP and human(h)LRRC37B-HA or chimpanzee(c)LRRC37B-HA cDNAs (arrows at the AIS). (B) Human (n = 62 from 9 animals from 3 litters) and chimpanzee (n = 18 neurons from 6 animals from 1 litter) LRRC37B colocalizes with ankyrin-G in mouse neurons transfected for LRRC37B and EGFP; note that in next panels, LRRC37B is for human LRRC37B (mean + SEM). (C) Corresponding quantification of the AIS length and position of mouse neurons transfected for LRRC37B (n = 62 from 9 animals from 3 litters) compared with control neurons (n = 59 from 9 animals from 3 litters) (B, mean + SEM; C, lines at median; Mann-Whitney tests). (D) Immunodetection of LRRC37A2-HIS in the mouse cerebral cortex after transfection of LRRC37A2-HIS and EGFP cDNAs. (E) Intrinsic properties of LRRC37B neurons (36 neurons from 12 animals from 4 litters) compared with control neurons (18 neurons from 7 animals from 4 litters) complementary to Figures 2B–2F (lines at median; Mann-Whitney tests). (F) Phase plot analysis of single evoked AP from control versus LRRC37B transfected neurons complementary to Figure 2F (see Method 2 in STAR Methods). (G) Phase plot analysis of single evoked AP of LRRC37B neurons (n = 10 neurons from 2 animals from 1 litter) and control neurons (n = 9 neurons from 2 animals from 1 litter) (see Method 1 in STAR Methods) (lines at median; Mann-Whitney tests). (H) Phase plot analysis of single evoked AP of LRRC37B neurons (n = 48 neurons from 16 animals from 8 litters) and control neurons (n = 25 neurons from 10 animals from 8 litters) (see Method 3 in STAR Methods) (lines at median; Mann-Whitney tests). (I) IV-curves (left, ionic currents) and maximum currents (right) of LRRC37B transfected neurons (n = 43 neurons) compared with of control neurons (n = 26 neurons) (left, mean + SEM; right, lines at median; Mann-Whitney tests). (J and K) Quantification of VGAT puncta, gephyrin-tdTomato puncta, and VGAT/gephyrin-tdTomato puncta in mouse neurons in utero electroporated for plasmids leading to a bicistronic expression of LRRC37B and EGFP (40 neurons for VGAT, 33 neurons for gephyrin quantifications, from 11 animals from 4 litters) or EGFP only (30 neurons for VGAT, 26 for gephyrin quantifications, from 8 animals from 3 litters) as well as gephyrin-tdTomato expression (lines at median; Mann-Whitney tests). (L) Excitatory and inhibitory postsynaptic potentials (E/I PSP) frequency and amplitude in LRRC37B transfected mouse neurons (10 neurons from 4 animals from 2 litters) versus control neurons (8 neurons from 4 animals from 2 litters) (lines at median; Mann-Whitney tests). ns, non-significant; p < 0.05; ∗∗p < 0.01.
Figure S4
Figure S4
LRRC37 proteins are receptors for FGF13A, related to Figure 3 (A) Representative plates of ELISA-based unbiased interactome screen next to measured values. The predicted extracellular sequence of LRRC37B (LRRC37B_ECTO) fused with alkaline phosphatase (ALP) was used as a bait; using LRRC37B_ECTO-ALP immobilized in each well of 384-well plates, 920 transmembrane or secreted proteins fused to a Fc domain were used as preys in each well: among them, only FGF13A-Fc was replicated and validated as a positive hit (blue wells vs. negative wells). (B) FGF13A co-immunoprecipitates the LRRC37B extracellular part (LRRC37B_ECTO) as well as its leucine-rich repeats (LRRs) but not the extracellular part devoid of the LRR from transfected HEK293T cells; the pictures and the left and right are from different gels from the same experiment. (C) IPs of human, chimpanzee, macaque LRRC37B proteins, or human LRRC37A2 protein from HEK293T cells transfected for their cDNA and FGF13A cDNA: all LRRC37 proteins except the macaque LRRC37B binds to FGF13A. (D) IPs of LRRC37B_ECTO and other transmembrane proteins (extracellular domain fused at the N-terminal with the prolactin leader peptide and an HA tag, and at the C-terminal with the transmembrane domain of PDGF-R) from HEK293T cells transfected for their cDNA and FGF13A cDNA; stars indicate the transmembrane protein in the input; the pictures and the left and right are from different gels from the same experiment. (E) Multi-angle light scattering with size-exclusion chromatography (SEC-MALS) of LRR recombinant protein showing a primary monomeric peak, with a low oligomeric fraction. (F) Binding assay of synthetic F13ExonS-biotin to transfected LRRC37B_ECTO (n = 6 experiments), transfected LRR_ECTO (n = 3), transfected ΔLRR_ECTO (n = 3), transfected display vector (n = 6), and non-transfected cells (n = 6) HEK293T cells (fitting curves for LRRC37B_ECTO and LRR_ECTO). (G) Binding assay of synthetic F13ExonS-biotin to transfected SCN8A (Nav1.6) (n = 11 experiments), transfected empty vector (n = 9), and non-transfected cells (n = 11) HEK293T cells (fitting curves for Nav1.6).
Figure 3
Figure 3
LRRC37B is a receptor for FGF13A (A) FGF13 codes for several spliced isoforms; cell lysate and medium samples of HEK293T cells transfected for FGF13A, FGF13B, FGF13VY, and FGF13-core cDNAs (stars indicate each isoform in the cell extracts) detected with FGF13 antibody. (B) LRRC37B-HA IP from HEK293T cells co-transfected for LRRC37B-HA cDNA and cDNAs coding for the different FGF13 isoforms (stars indicate each isoform in the inputs) detected with FGF13 antibody. (C) LRRC37B-HA IP from HEK293T cells transfected for LRRC37B-HA cDNA and with recombinant FGF13A or its synthetic F13ExonS applied in the culture medium detected with a FGF13A-specific antibody (used in next panels). (D and E) IP from HEK293T cells transfected with LRRC37B and mutants lacking or carrying LRR of the extracellular domain and treated with recombinant FGF13A in the culture medium (stars indicate each LRRC37B protein in the inputs). (F) Fluorescence polarization (FP) assay between LRR recombinant protein and F13ExonS peptide, F13ExonU peptide (part of FGF13B) and two random peptides (n = 9 measures; mean ± SD). (G) IP of Nav1.6 (SCN8A) from HEK293T cells transfected for SCN8A cDNA with recombinant FGF13A or its synthetic F13ExonS applied in the culture medium. (H) Nav1.6 IPs from HEK293T cells transfected for SCN8A ± FGF13A ± LRRC37B cDNAs. (I) Schematics of the LRRC37B-FGF13A-Nav1.6 interaction. See also Figure S4.
Figure 4
Figure 4
FGF13A regulates neuronal excitability through its F13ExonS peptide (A) Examples traces of evoked AP of mouse CPNs (barrel cortex, P24–P32) with 50 nM recombinant FGF13A or synthetic F13ExonS extracellular application. (B) Corresponding firing rates (mean + SEM). (C) Dose-response effect of recombinant FGF13A extracellular application on mouse CPNs at 0 nM (11 neurons from 3 animals), 5 nM (8 neurons from 3 animals), 10 nM (9 neurons from 2 animals), and 50 nM (10 neurons from 4 animals) or synthetic F13ExonS at 50 nM (18 neurons from 8 animals) (values for each neuron are normalized to their initial value before application; lines at median; for each dose, paired Wilcoxon test). (D) Similar dose-response effects on rheobase. (E) Single evoked AP examples and dose-response effects on AP properties (shown as in C). (F) Phase plot analysis of AP generation (multiple trains, Method 4) with 50 nM FGF13A or F13ExonS extracellular application on mouse CPNs (each replicate in blue or purple; mean + SEM in black; paired Wilcoxon tests). ns, non-significant; p < 0.05; ∗∗p < 0.01; ∗∗∗p < 0.001. See also Figure S5.
Figure S5
Figure S5
FGF13A act extracellularly, but not intracellularly, on neuronal excitability, related to Figure 4 (A and B) Electrophysiological properties complementary to Figure 4, with treatment of mouse cortical sections (barrel cortex, layer 2/3 CPNs) with recombinant FGF13A extracellularly at 0 nM (11 neurons from 3 animals), 5 nM (8 neurons from 3 animals), 10 nM (9 neurons from 2 animals), and 50 nM (10 neurons from 4 animals) or synthetic F13ExonS at 50 nM (18 neurons from 7 animals) (values for each neuron are normalized to their initial value before application; lines at median; for each dose paired Wilcoxon test: all comparisons are ns). (C) IV-curves (ionic currents, mean + SEM) and normalized maximum currents (values normalized to values before application; lines at median; paired Wilcoxon tests for each dose) of mouse CPNs with extracellular application of recombinant FGF13A at 0, 5, 10, and 50 nM or synthetic F13ExonS extracellular application at 50 nM. (D) Phase plot analysis of AP generation in multiple AP trains from mouse neurons before and after FGF13A or F13ExonS 50 nM application complementary to Figure 4F (see Method 4 in STAR Methods). (E) AP firing rate (left, mean + SEM; right, line at median; Mann-Whitney test) and rheobase (line at median; Mann-Whitney test) of mouse neurons (barrel cortex, layer 2/3 CPNs) with/without 50 nM intracellular application of recombinant FGF13A (control: 18 neurons from 7 animals; FGF13A: 8 neurons from 2 animals). (F) AP properties of mouse neurons with/without 50 nM intracellular application of recombinant FGF13A (lines at median; Mann-Whitney tests). (G) Electrophysiological properties of mouse neurons with/without 50 nM intracellular application of recombinant FGF13A (lines at median; Mann-Whitney tests). (H) Phase plot analysis of APs generation in multiple AP trains of mouse neurons with/without 50 nM intracellular application of recombinant FGF13A (lines at median; Mann-Whitney tests) (see Method 4 in STAR Methods). (I) IV-curves ionic currents) and maximum currents (lines at median; Mann-Whitney tests) of mouse neurons with/without 50 nM intracellular application of recombinant FGF13A (18 neurons from 7 animals for each condition). ns, non-significant; p < 0.05; ∗∗p < 0.01.
Figure S6
Figure S6
LRRC37B interacts with FGF13A following gain of function in the mouse cerebral cortex, related to Figure 5 (A) IP of LRRC37B-HA from mouse cortical protein extract (P17) of LRRC37B-HA/EGFP transfected mouse cortex compared with EGFP alone. (B) Quantification of FGF13A staining at the soma and AIS levels (27–28 neurons from 9 animals from 3 litters per condition; lines at median; Mann-Whitney tests) related to Figure 5B. (C) Autocorrelation of the LRRC37B, FGF13A, and Navα signals (mean ± SEM) and corresponding periodicity (n = 21 neurons from 3 animals from 3 litters for the LRRC37B/FGF13A and for the LRRC37B/Navα stainings for control and LRRC37B neurons; line at mean) related to Figure 5A. (D and E) Electrophysiological properties complementary to Figures 5C–5G of mouse pyramidal neurons (layer 2/3 barrel cortex) transfected for LRRC37B/EGFP (15 neurons from 8 animals from 5 litters) or EGFP only (n = 13 neurons from 7 animals from 5 litters) before and after recombinant FGF13A protein 50 nM application (in gray and pink, each replicate; in dark and red, mean + SEM; paired Wilcoxon tests to test the application per group, Mann-Whitney tests to compare groups before and after applications). (F) Phase plot analysis of AP generation in multiple AP trains from control and LRRC37B-transfected mouse neurons before and after FGF13A 50-nM application complementary to Figure 5G (see Method 4 in STAR Methods). (G) IV-curves (ionic currents; mean + SEM) and maximum currents of mouse pyramidal neurons transfected for LRRC37B/EGFP or EGFP only before and after with recombinant FGF13A protein 50 nM application (in gray and pink, each replicate; in dark and red, mean + SEM; paired Wilcoxon tests to test the application per group, Mann-Whitney tests to compare groups before and after applications). ns, non-significant; p < 0.05; ∗∗p < 0.01; ∗∗∗p < 0.001; ∗∗∗∗p < 0.0001.
Figure 5
Figure 5
LRRC37B concentrates FGF13A at the level of the AIS (A) AIS of LRRC37B and control CPNs immunostained for EGFP, LRRC37B, FGF13A, and Navα subunits (Nav channels). (B) LRRC37B and control CPNs immunostained for EGFP and FGF13A. (C) Examples of traces of evoked AP of control and LRRC37B neurons with 50-nM recombinant FGF13A extracellular application. (D and E) Corresponding firing rates (mean + SEM) of LRRC37B neurons (15 neurons from 8 animals from 5 litters) and control neurons (13 neurons from 7 animals from 5 litters) with corresponding quantification (D) and rheobase (E) (in gray and pink, each replicate; in dark and red, mean + SEM; paired Wilcoxon tests to test the application per group, Mann-Whitney tests to compare groups before and after applications). (F) Corresponding single evoked AP examples and properties (shown as in D and E). (G) Phase plot analysis of AP (multiple train) in LRRC37B neurons (11 neurons from 6 animals from 3 litters) and control neurons (10 neurons from 4 animals from 3 litters) with 50 nM FGF13A extracellular application (shown as in D and E) (Method 4). ns, non-significant; p < 0.05; ∗∗p < 0.01. See also Figure S6.
Figure S7
Figure S7
LRRC37B function in human neurons, related to Figures 6 and 7 (A) LRRC37B_ECTO-Fc pull down from rat cortical extracts. AIS proteins unique for the LRRC37B_ECTO-Fc condition not found in the control condition are depicted. (B) IPs of human, chimpanzee, macaque LRRC37B proteins or human LRRC37A2 protein from HEK293T cells transfected for their cDNA and SCN1B cDNA: all LRRC37B proteins bind to SCN1B but not LRRC37A2. (C) LRRC37B, FGF13, SCN1B, and SCN8A transcripts detection in human cortical cells (from Allen Brain Map, Human MTG 10× SEA-AD dataset published in Hodge et al.35). (D) Mouse CPNs (11 neurons from 3 individuals, P28, barrel cortex) display a higher excitability than human neurons (40 neurons, from 9 individuals, from 4 to 62 years old, temporal cortex) (some data for human neurons are also included in Figure 7E) (left, mean + SEM; right, line at median, Mann-Whitney test). (E) Electrophysiological properties complementary to Figures 7D–7H of human neurons LRRC37B-positive (35 neurons from 12 individuals, 4–62 years old) versus LRRC37B-negative (32 neurons from 12 individuals, 4–62 years old) (lines at median; Mann-Whitney tests). (F) IV-curves (mean + SEM, ionic currents) and maximum currents (lines at median, Mann-Whitney tests) of LRRC37B-negative and LRRC37B-positive neurons. (G) Phase plot analysis of single evoked AP from LRRC37B-negative and LRRC37B-positive human neurons complementary to Figure 7H (see Method 2 in STAR Methods). (H) Phase plot on single evoked AP of LRRC37B-positive and LRRC37B-negative neurons (n = 11 neurons per condition from 6 individuals, 7–56 years old; lines at median; Mann-Whitney tests) (see Method 3 in STAR Methods). (I) Cortical depth and soma size of the patched neurons (lines at median; Mann-Whitney tests). (J and K) AIS morphological properties of human LRRC37B-negative (110 neurons from 3 individuals, 22–38 years old) and LRRC37B-positive (93 neurons from 3 individuals, 22–38 years old) neurons (lines at median; Mann-Whitney tests). ns, non-significant; p < 0.05; ∗∗∗∗p < 0.0001.
Figure 6
Figure 6
LRRC37B binds to SCN1B through its specific B domain (A and B) IP of different protein lacking or carrying the LB specific domain of the extracellular domain of LRRC37B from HEK293T cells co-transfected for the SCN1B cDNA. (C) SCN1B IPs from HEK293T cells transfected for SCN1B ± LRRC37B ± FGF13A cDNAs. (D) Nav1.6 IPs from HEK293T cells transfected for SCN8A ± SCN1B ± LRRC37B cDNAs. See also Figure S7.
Figure 7
Figure 7
LRRC37B-positive human neurons display decreased neuronal excitability at the AIS (A) Navα IP from human cerebral cortex (temporal cortex, 25 years old); the input and IP lanes are from the same gel. (B and C) Layer 2/3 human CPNs filled by biocytin which enables to correlate their properties to the LRRC37B post hoc detection (arrows) (B, 4 years old; C, 62 years old). (D) Examples of traces of evoked AP of neurons LRRC37B-positive versus LRRC37B-negative (62 years old). (E and F) Firing rates (E; left: mean + SEM) and rheobase (F) of LRRC37B-positive neurons (35 neurons from 12 individuals, 4–62 years old) versus LRRC37B-negative neurons (32 neurons from 12 individuals, 4–62 years old) (E, right, and F; lines at median; Mann-Whitney tests). (G) Individual single evoked AP examples (62 years old) and properties of LRRC37B-positive and LRRC37B-negative neurons (lines at median; Mann-Whitney test). (H) Phase plot on single evoked AP of LRRC37B-positive (n = 35 neurons from 12 individuals, 4–62 years old) and LRRC37B-negative neurons (n = 32 neurons from 12 individuals, 4–62 years old) (lines at median; Mann-Whitney tests) (Method 2). ns, non-significant; p < 0.05; ∗∗∗p < 0.001; ∗∗∗∗p < 0.0001. See also Figure S7.

Comment in

References

    1. Richerson P.J., Gavrilets S., de Waal F.B.M. Modern theories of human evolution foreshadowed by Darwin’s Descent of Man. Science. 2021;372:eaba3776. - PubMed
    1. Buckner R.L., Krienen F.M. The evolution of distributed association networks in the human brain. Trends Cogn. Sci. 2013;17:648–665. - PubMed
    1. Herculano-Houzel S. The human brain in numbers: a linearly scaled-up primate brain. Front. Hum. Neurosci. 2009;3:31. - PMC - PubMed
    1. Vanderhaeghen P., Polleux F. Developmental mechanisms underlying the evolution of human cortical circuits. Nat. Rev. Neurosci. 2023;24:213–232. - PMC - PubMed
    1. Sousa A.M.M.M., Meyer K.A., Santpere G., Gulden F.O., Sestan N. Evolution of the human nervous system function, structure, and development. Cell. 2017;170:226–247. - PMC - PubMed

Publication types

Substances