. 2023 Dec 21;186(26):5798-5811.e26.
doi: 10.1016/j.cell.2023.11.025.

Structural evolution of fibril polymorphs during amyloid assembly

Affiliations

Structural evolution of fibril polymorphs during amyloid assembly

Martin Wilkinson et al. Cell. .

Abstract

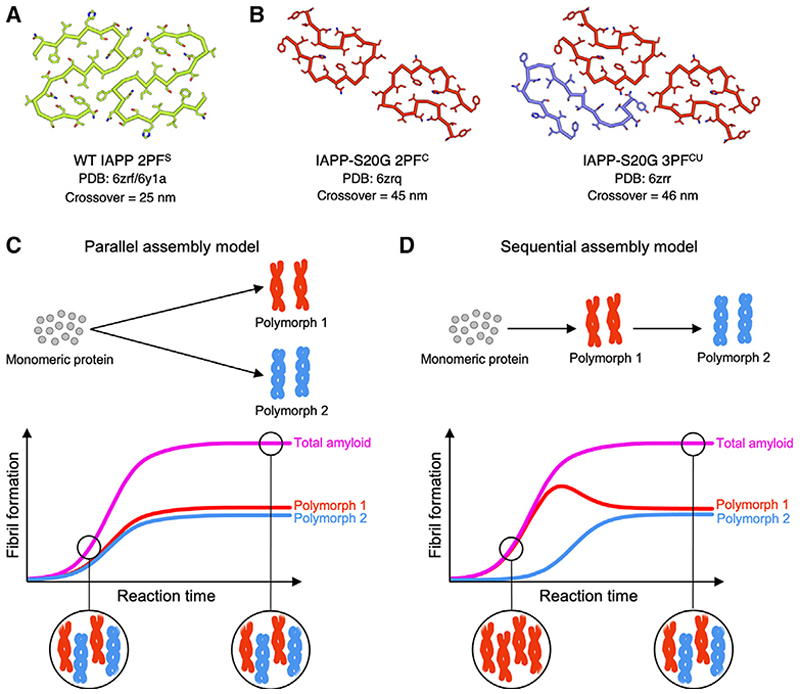
Cryoelectron microscopy (cryo-EM) has provided unprecedented insights into amyloid fibril structures, including those associated with disease. However, these structures represent the endpoints of long assembly processes, and their relationship to fibrils formed early in assembly is unknown. Consequently, whether different fibril architectures, with potentially different pathological properties, form during assembly remains unknown. Here, we used cryo-EM to determine structures of amyloid fibrils at different times during in vitro fibrillation of a disease-related variant of human islet amyloid polypeptide (IAPP-S20G). Strikingly, the fibrils formed in the lag, growth, and plateau phases have different structures, with new forms appearing and others disappearing as fibrillation proceeds. A time course with wild-type hIAPP also shows fibrils changing with time, suggesting that this is a general property of IAPP amyloid assembly. The observation of transiently populated fibril structures has implications for understanding amyloid assembly mechanisms with potential new insights into amyloid progression in disease.

Keywords: amyloid; amyloid polymorphism; cryoEM; diabetes; kinetics; protein aggregation; protein fibrils; protein structure; structural biology.


Conflict of interest statement

Declaration of interests The authors declare no competing interests.

Figures

Graphical abstract
Graphical abstract
Figure 1
Figure 1. The assembly of polymorphic amyloid fibrils—does polymorphism change during the course of aggregation?
(A–D) Cartoon views of the (A) WT hIAPP amyloid and (B) IAPP-S20G amyloid fibril structures formed in vitro published in our previous study, with nomenclature of the fibril type and chain coloring chosen to match those reported herein. Note that similar structures of WT IAPP fibrils have been reported by others., Simplified cartoon schemes for possible polymorphic fibril assembly processes via a (C) parallel or a (D) sequential model. Below each proposed model, illustrative cartoon plots are shown corresponding to different fibril assembly reactions that yield a similar mixed polymorph population at the end point. The typical sigmoidal growth for bulk amyloid formation (magenta, e.g., monitored by ThT fluorescence) can mask the underlying, potentially divergent assembly processes of individual polymorphs (red and blue). The schematics represent contrasting example cases from a spectrum of possible assembly mechanisms, and other models likely exist, including mixed parallel/sequential models and those including secondary nucleation on the fibril surface. This highlights the need to better understand the kinetic relationships between different structural polymorphs during an aggregation reaction. Determining whether polymorphism remains constant throughout self-assembly or different polymorphs appear sequentially is a crucial step toward that goal. See also Figure S8.
Figure 2
Figure 2. Initial characterization of IAPP-S20G fibril populations over time
(A) Aliquots from fibrillation reactions were removed at different times and ThT fluorescence measured (red). hIAPP-S20G remaining in the supernatant after centrifugation (STAR Methods) was monitored in parallel using HPLC (blue). The time course highlights the lag, growth, and plateau phases of assembly and shows that early aggregated species either do not bind ThT or fluoresce only weakly in its presence. Peptide integrity was confirmed at the end of the reaction using LC-MS as shown in Figure S1. (B) Representative negative stain (ns)EM images of IAPP-S20G fibrils at different time points (3, 6, and 22 weeks) representing the lag, growth, and plateau phases of the ThT profile (scale bar represents 80 nm). Adjacent to each are zoomed sections from multiple nsEM images showing the diversity of fibril morphologies observed at each time point (box dimensions ~240 × 45 nm). Additional nsEM images from different time points are shown in Figure S2. (c) Heatmap of the percentage distribution of fibril crossovers measured from nsEM images of IAPP-S20G samples at different incubation times. Multiple fibrillation reactions contributed to each reaction time (except for the 22-week time point) as outlined in the STAR Methods (all reactions are individually plotted in Figure S3). The percentage of fibrils within each crossover length group is colored for each separate population, according to the displayed key, with a black line plot tracking these values for each time point. The number of fibrils measured for each time point is annotated on the x axis by “n.”
Figure 3
Figure 3. Different IAPP-S20G fibril populations are present in each phase of assembly
(A) Representative cryo-EM images from each dataset collected for different IAPP-S20G fibrillation time points (3 week, lag phase; 6 week, growth phase; and 22 week, plateau phase). The scale bar (white) represents 100 nm. (B) The 40 most populated 2D class averages are shown for each dataset color coded by the apparent fibril polymorph determined by the crossover distance, ordered by class occupancy (top left to bottom right). Class averages with fibril segments showing no observable crossover features are labeled in dark gray, and those showing ambiguous internal features that could not be reliably grouped into other forms are labeled in white. Constructed using 23 binned particles of the full set of segments for each dataset after the removal of picking artifacts. The box size is ~50 nm. C) Zoomed images of selected 2D class averages from the datasets shown in (B), representing the different regular fibril forms initially identified. The measured fibril crossover distance is annotated for each. See Figure S4 for a comparison with 2D class averages from a replicate 3-week sample.
Figure 4
Figure 4. Cryo-EM structure determination reveals that multiple IAPP-20G fibril polymorphs differentially populate the different phases of assembly
Pie chart of the fibril polymorph assignments from all the segments processed within the (A) 3-week, (E) 6-week, and (H) 22-week cryo-EM datasets of IAPP-S20G. The coloring matches the fibril polymorphs displayed throughout the figure and Figure 3, with gray representing unidentifiable fibril structures. Slice view of a layer of the final IAPP-S20G (B) 3-week, (F) 6-week, and (I) 22-week maps for each fibril polymorph, which were generated by averaging the central six slices, corresponding to an ~5 Å section of each map. Perpendicular views of the core and fibril surface of each of the deposited maps from the (C) 3-week, (G) 6-week, and (K) 22-week cryo-EM datasets. (D) Superposition of a single layer of the 3-week IAPP-S20G 2PFP (PDB: 8awt, dark green) and the WT IAPP 2PFS (PDB: 6zrf, light green) structures showing that they share a conserved inter-protofilament interface (involving residues 23FGAIL, shown as sticks) and subunit core fold between residues 15–28 (highlighted blue/red). The location of the mutation S20G is highlighted on the 2PFP model. (J) Zoomed section of the 22-week IAPP-S20G 2PFL map transparent to show modeling of an ordered water channel (red spheres) at the inter-protofilament interface. The colors used to denote each fibril type are consistent throughout all figures. See cryo-EM processing details in Figure S5 (3-week dataset), Figure S6 (6-week dataset), and Figure S9 (22-week dataset), respectively.
Figure 5
Figure 5. Different IAPP-S20G fibril structures and subunit folds observed during the fibrillation time course
(A) Cartoon view of the seven unique IAPP-S20G fibril structures solved to high resolution. Peptide backbones are color coded in relation to the five different subunit folds present in the fibril assemblies (P, green; L, yellow; C, red; U, blue; and J, pink). The structures are grouped based on the fold of the 2PF core of the fibrils (P-lineage, green; L-lineage, yellow; and C-lineage, red). (B) Ribbon view of the five distinct IAPP-S20G subunit folds, colored as in (A). The N- and C-terminal residues ordered in each structure are numbered. (C) Superposition of the five different subunit folds, aligned on the structurally conserved sequence 20GNNFG24 for which the side chains are displayed as sticks. (D) Superposition of 2PFL (yellow) and 2PFP (green), aligned on one of the peptide chains from each structure. The second chain of each fibril interacts on opposite sides of the superposed chain, highlight that the fibril architectures are very different.(G) (E) Superposition of one layer of each of the three L-lineage fibril structures, colored by structure (2PFL, yellow; 4PFLU, orange; and 4PFLJ, pink). The three structures share a conserved 2PF core (RMSD Cα atoms is 0.38 Å [54 atoms], 2PFL vs. 4PFLU and 0.44 Å [56 atoms], 2PFL vs. 4PFLJ). (G) Superposition of one layer of each of the three C-lineage fibril structures, colored by structure (2PFC, red; 3PFCU, blue; and 4PFCU, purple). The three structures share a conserved 2PF core (RMSD Cα atoms is 0.39 Å [44 atoms], 2PFC vs. 3PFCU and 0.48 Å [40 atoms], 2PFC vs. 4PFCU). See also Figure S7 to see the fit of each displayed model into its respective cryo-EM map and Figure S10 for further images of the L-lineage 2PFL, 4PFLU, and 4PFLJ fibril assemblies. Both PyMol (Schrödinger) and ChimeraX were used for making structure figures.
Figure 6
Figure 6. Summary plots describing the structural maturation of IAPP-S20G fibril polymorphs during the assembly time course
(A) Line plot of the distribution of the different fibril polymorphs observed in each cryo-EM dataset (right y axis). For reference, the normalized ThT fluorescence from Figure 2A indicating reaction progression is plotted on the left y axis (black line). Pie charts above show the percent of each fibril type in the 3-, 6-, and 22-week samples. (B) Bar graph of the distribution of the different subunit folds observed within the fibrils from each cryo-EM dataset, calculated according to the distribution of polymorphs and number of each subunit fold per fibril layer. (C) Bubble plot of the fibril crossover distributions at different time points measured from nsEM images, using the same data as in Figure 2C. The size of the bubble relates directly to the number of fibrils with the same crossover and the average values for each time point are tracked with black crosses and a black line. The expected crossover range for the seven fibril polymorphs, colored as in (A) are shown as lines in each respective color. (D) Bar graph of the distribution of different sized fibril assemblies, including all 2PF, 3PF, and 4PF polymorphs for each cryo-EM dataset showing a shift from 2PF to 4PF fibril assemblies as fibril formation progresses. (E) Bar chart of the average ΔG°/layer (left y axis) and ΔG°/residue (right y axis) of fibrils at different time points based on the distribution of different polymorphs and the number of ordered residues in each layer of the fibril. The values for each polymorph were calculated as the average from two independent methods based on FoldX and described by Eisenberg/Sawaya, (as shown in Figure S11 with further depiction of the calculated stability of each structure). (F) Summary scheme of the different fibril structures seen at each time point divided into the P-, C-, and L-lineages, respectively, showing a shift toward 4PF assemblies in the plateau sample.
Figure 7
Figure 7. Cartoon summary of IAPP-S20G polymorph progression with a proposed mechanism of different kinetic landscapes during the different stages of assembly
(A) Cartoon ThT plot of the IAPP-S20G time course in the style of Figures 1C and 1D with windows representing the different ratios of species observed at each stage of assembly. Black squiggles represent unstructured monomer, gray tubes represent untwisted fibrils, and the resolved fibril polymorphs are represented by their respective core structures, colored by subunit fold as in Figure 6. (B) Potential assembly pathway schematic based on the fibril architectures and order of appearance. Each step is presumed to be reversible, and all plausible transitions have been included. It should be noted that other intermediates may exist that have not been captured, the untwisted fibrils may contain a mixture of states, and that monomer could directly contribute to all of the fibril assemblies. (C) Illustrative energy landscapes for each stage of IAPP-S20G assembly, based on the observed structures and their calculated stability based on a single fibril layer to scale each peak height. Each peak is labeled by the fibril structure it represents. Not intended as a comprehensive depiction but rather a potential snapshot of the kinetically accessible states at each assembly stage. See also Figure S11.

References

    1. Schnabel J. Protein folding: the dark side of proteins. Nature. 2010;464:828–829. - PubMed
    1. Goldschmidt L, Teng PK, Riek R, Eisenberg D. Identifying the amylome, proteins capable of forming amyloid-like fibrils. Proc Natl Acad Sci USA. 2010;107:3487–3492. doi: 10.1073/pnas.0915166107. - DOI - PMC - PubMed
    1. Sergeeva AV, Galkin AP. Functional amyloids of eukaryotes: criteria, classification, and biological significance. Curr Genet. 2020;66:849–866. - PubMed
    1. Iadanza MG, Jackson MP, Hewitt EW, Ranson NA, Radford SE. A new era for understanding amyloid structures and disease. Nat Rev Mol Cell Biol. 2018;19:755–773. - PMC - PubMed
    1. Ferrone F. Analysis of protein aggregation kinetics. Methods Enzymol. 1999;309:256–274. - PubMed

Publication types