. 2023 Dec 21;83(24):4509-4523.e11.
doi: 10.1016/j.molcel.2023.11.025.

Subcytoplasmic location of translation controls protein output

Affiliations

Subcytoplasmic location of translation controls protein output

Ellen L Horste et al. Mol Cell. .

Abstract

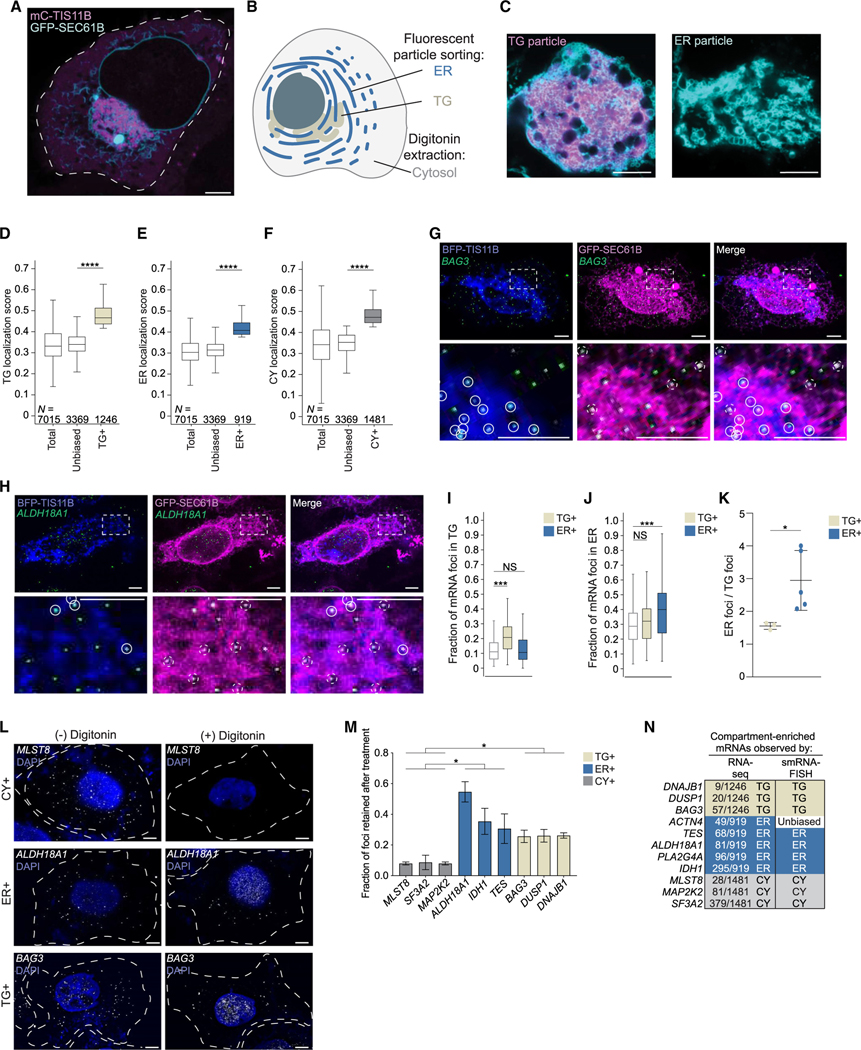
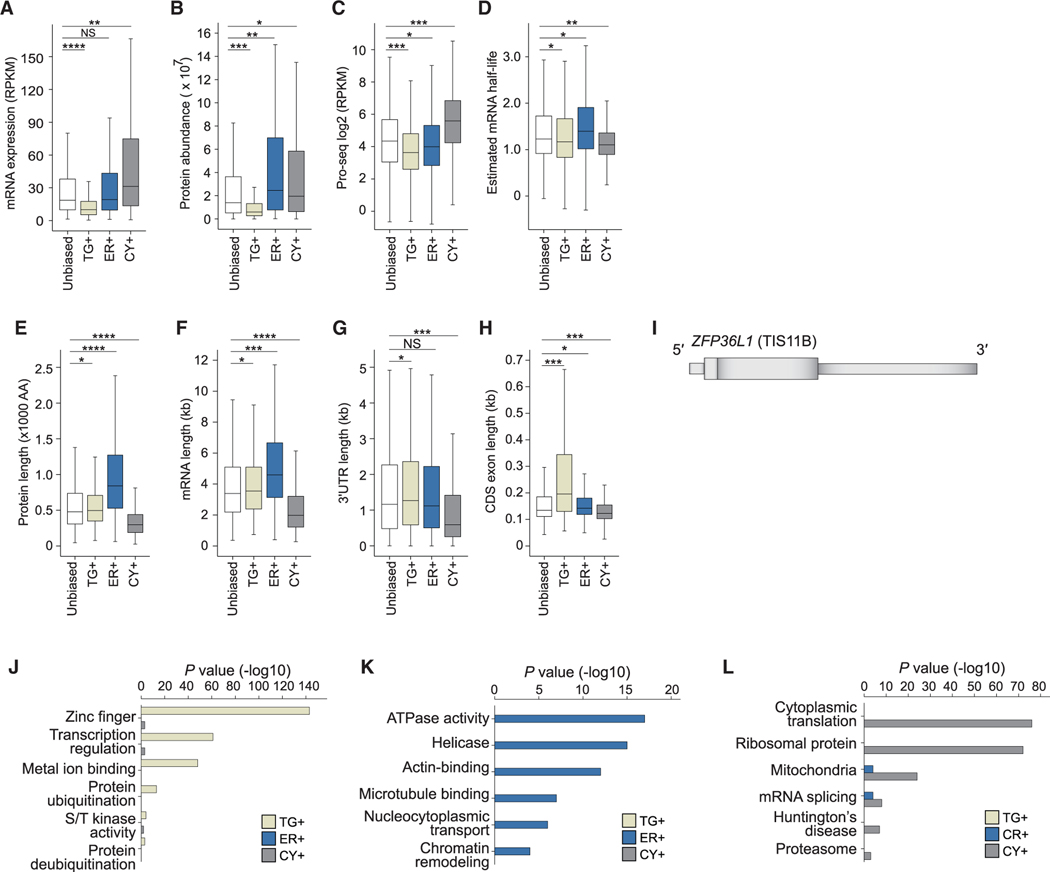
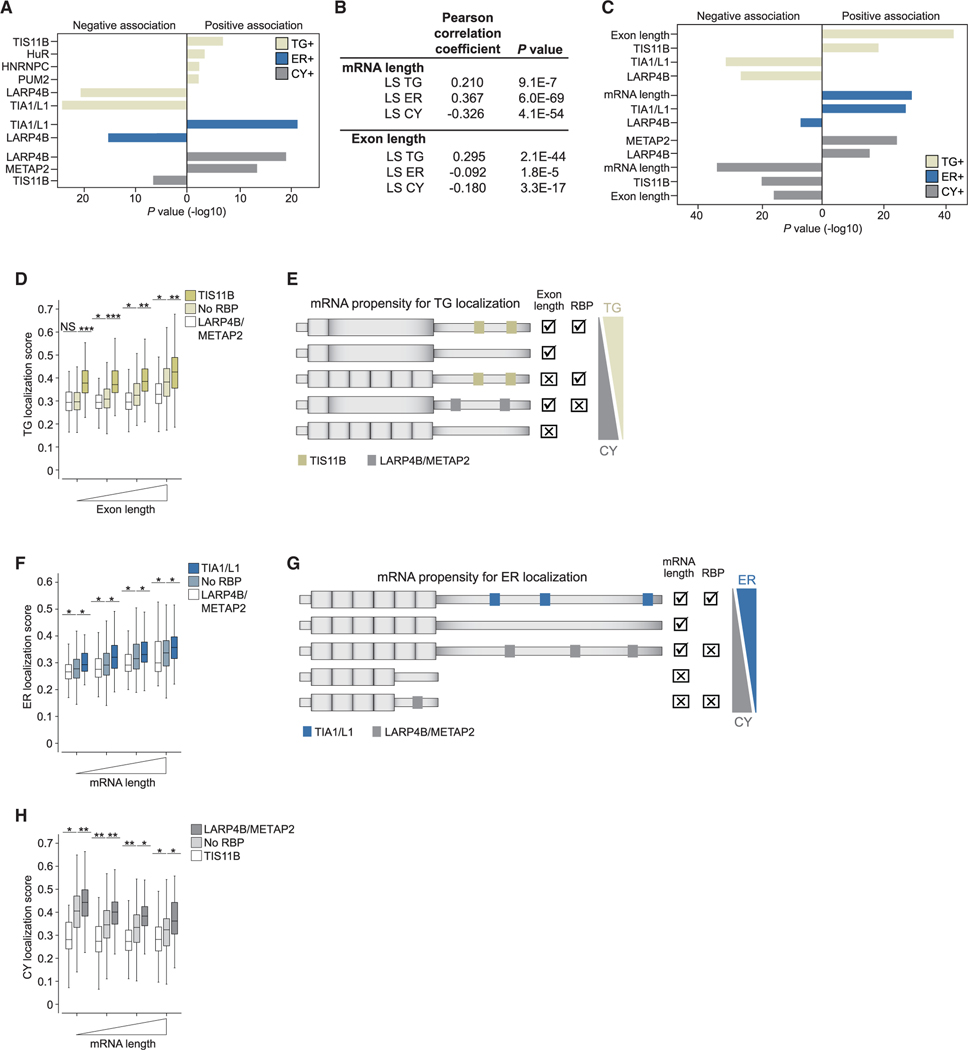
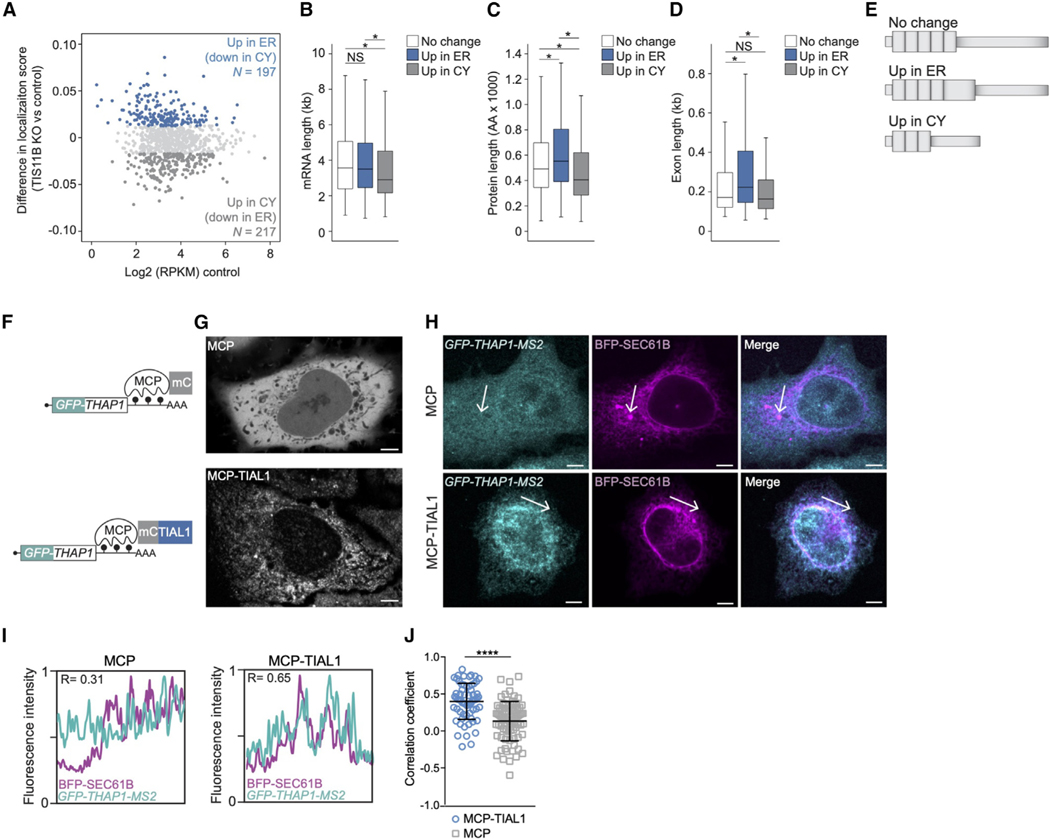
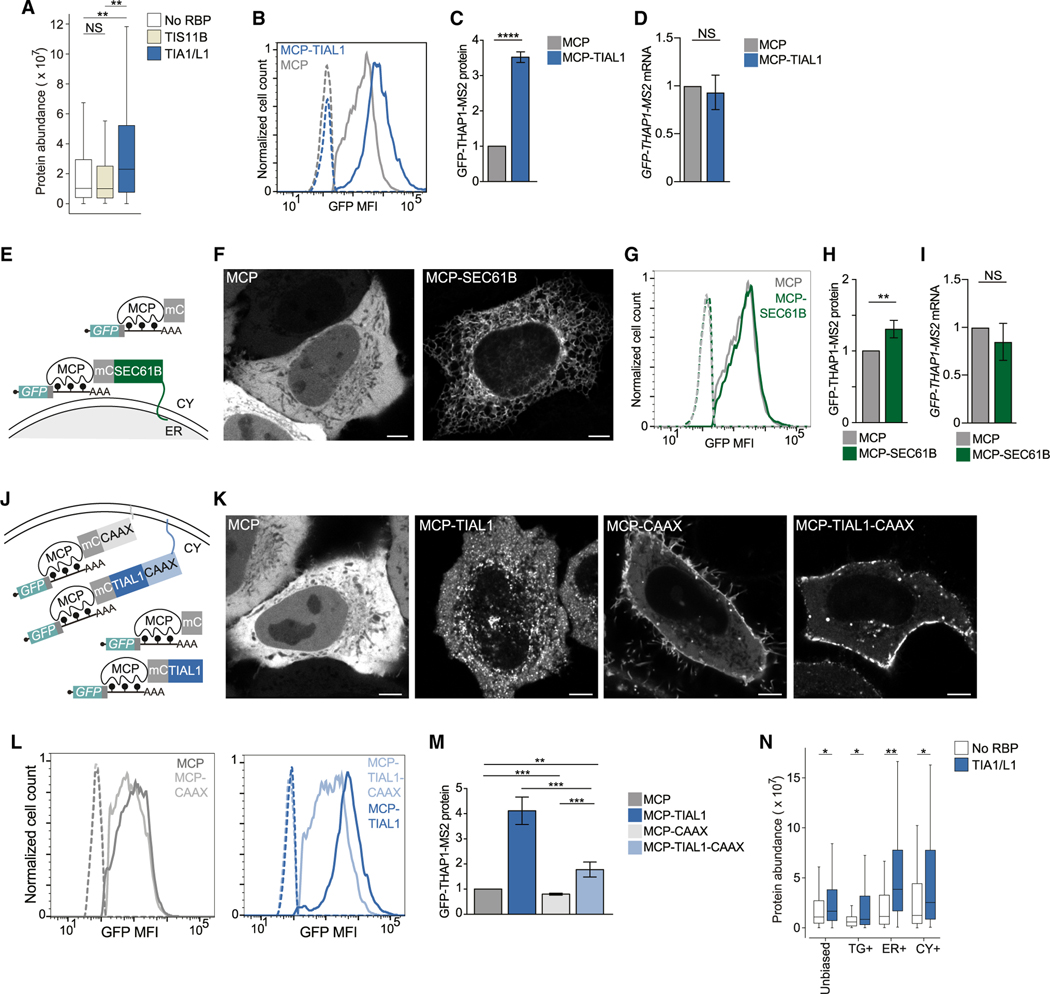
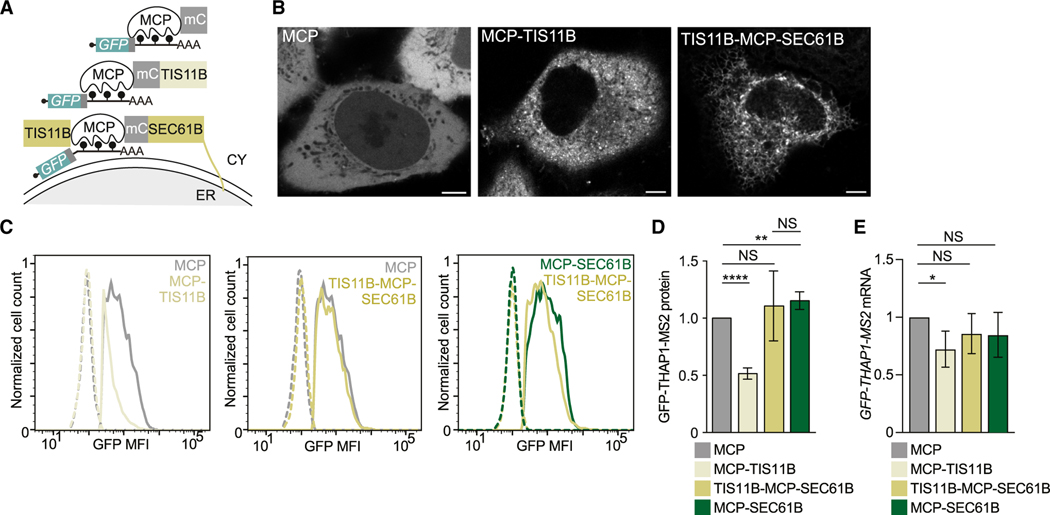
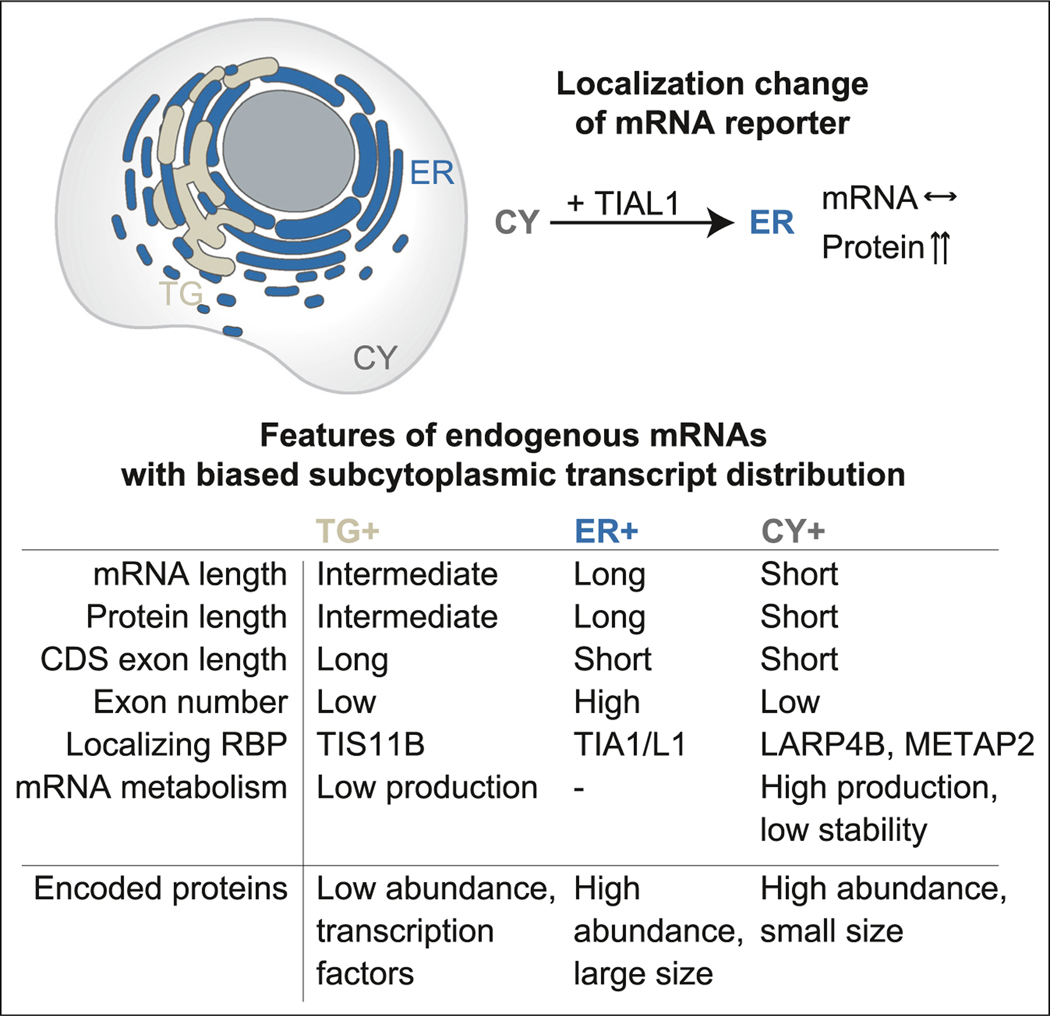
The cytoplasm is highly compartmentalized, but the extent and consequences of subcytoplasmic mRNA localization in non-polarized cells are largely unknown. We determined mRNA enrichment in TIS granules (TGs) and the rough endoplasmic reticulum (ER) through particle sorting and isolated cytosolic mRNAs by digitonin extraction. When focusing on genes that encode non-membrane proteins, we observed that 52% have transcripts enriched in specific compartments. Compartment enrichment correlates with a combinatorial code based on mRNA length, exon length, and 3' UTR-bound RNA-binding proteins. Compartment-biased mRNAs differ in the functional classes of their encoded proteins: TG-enriched mRNAs encode low-abundance proteins with strong enrichment of transcription factors, whereas ER-enriched mRNAs encode large and highly expressed proteins. Compartment localization is an important determinant of mRNA and protein abundance, which is supported by reporter experiments showing that redirecting cytosolic mRNAs to the ER increases their protein expression. In summary, the cytoplasm is functionally compartmentalized by local translation environments.

Keywords: 3′ UTR; CDS exon length; RNA-binding proteins; TIAL1; TIS granules; TIS11B; condensates; cytoplasmic organization; endoplasmic reticulum; gene architecture; mRNA length; mRNA localization; spatial regulation of protein synthesis; translation environment.


Conflict of interest statement

Declaration of interests The authors declare no competing interests.

Figures

Figure 1.
Figure 1.. Strategy to identify compartment-enriched mRNAs
(A) Confocal live cell imaging of HeLa cells after transfection of mCherry (mC)-TIS11B and GFP-SEC61B to visualize TGs and the rough ER. Scale bars, 5 μm. (B) Schematic of a cell with three cytoplasmic compartments. (C) As in (A) but showing fluorescent TG (left) and ER (right) particles. (D) Transcript localization scores obtained from TG samples. Mann-Whitney test, p = 0. Boxplots depict median, 25th and 75th percentiles (box), and 5% and 95% confidence intervals (error bars). (E) Transcript localization scores obtained from ER samples. Mann-Whitney test, p = 1 × 10−123. (F) Transcript localization scores obtained from CY samples. Mann-Whitney test, p = 0. (G) smRNA-FISH of endogenous TG+ mRNA BAG3 (green) in HeLa cells. TIS granules (BFP-TIS11B, blue) and the ER (GFP-SEC61B, magenta) were simultaneously visualized. Bottom panel shows 5 × zoom-in of boxed area. White circles: mRNA colocalization with TG, dashed white circles: mRNA colocalization with ER. Representative images are shown. Scale bars, 5 μm. (H) As in (G), but smRNA-FISH of the ER+ mRNA ALDH18A1. (I) Quantification of smRNA-FISH foci. White boxplot: expected fraction of mRNA transcripts based on TG compartment size (n = 186 cells). ***p = 5 × 10⁻¹¹ (Mann-Whitney test). Additional images in Figures S2A–S2F. Individual values are shown in Figures S2H and S2I. (J) As in (I). White boxplot: expected fraction of mRNA transcripts based on ER compartment size (n = 186 cells). ***p = 1 × 10⁻⁶. (K) The ratio of smRNA-FISH foci colocalizing with the ER compared with the foci colocalizing with TGs, shown for mRNAs from (I) and (J). t test for independent samples, *p = 0.044. Horizontal line, median; error bars; 25th and 75th percentiles. (L) smRNA-FISH foci of endogenous mRNAs in HeLa cells before (−) and after (+) digitonin extraction. Dotted lines indicate cell boundaries. Representative images are shown. Scale bars, 5 μm. (M) Quantification of (L). Shown is the fraction of digitonin-resistant smRNA-FISH foci of endogenous mRNAs as mean ± SD of three independent experiments. Number of cells analyzed, see Table S2. Additional images in Figures S3A–S3C. t test for independent samples, *p < 0.041. (N) smRNA-FISH validation summary. Shown is ranking obtained from localization scores.
Figure 2.
Figure 2.. Characteristics of compartment-enriched mRNAs
(A) Steady-state mRNA abundance levels obtained from whole-cell lysates. TG+, N = 1,246; ER+, N = 919, CY+, N = 1,481; unbiased, N = 3,369. Mann-Whitney test: *0.05 > p > 10−9; **10−10 >p> 10−20; ***10−21 >p> 10−80; ****10−81 > p > 0. Exact p values are listed in Table S3. Boxplots depict median, 25th and 75th percentiles (box), and 5% and 95% confidence intervals (error bars). (B) As in (A), but steady-state protein levels obtained from whole-cell lysates are shown. TG+, N = 469; ER+, N = 638; CY+, N = 833; unbiased, N = 2,001. (C) As in (B), but Pro-seq levels are shown, which indicate transcription rates. TG+, N = 1,222; ER+, N = 896; CY+, N = 1,425; unbiased, N = 3,268. (D) As in (C), but estimated mRNA half-lives are shown. (E) As in (A), but protein size distributions are shown. AA, amino acid. (F) As in (A), but mRNA length distributions are shown. (G) As in (A), but 3′ UTR length distributions are shown. (H) As in (A), but average CDS exon length distributions are shown. (I) ZFP36L1 (TIS11B) mRNA model. Tall boxes: CDS exons, narrow boxes: 5′ and 3′ UTRs. (J) Gene ontology analysis for TG+ mRNAs. Top six functional gene classes uniquely enriched in TG+ mRNAs and Benjamini Hochberg-adjusted p values are shown. (K) As in (J), but for ER+ mRNAs. (L) As in (J), but for CY+ mRNAs.
Figure 3.
Figure 3.. mRNA architecture features together with RBPs determine the subcytoplasmic transcript distribution
(A) Logistic regression results for 3′ UTR-bound RBPs positively or negatively associated with compartment-enriched mRNAs. Full values in Table S4. (B) Pearson’s correlation coefficients of mRNA and coding exon length with compartment localization scores (LSs). (C) As in (A) but integrating 3′ UTR-bound RBPs from (A) and mRNA architecture features. (D) Propensity of mRNAs for TG localization stratified by coding exon length and bound RBPs. No RBP (N = 1,498), bound by LARP4B or METAP2 (N = 717) or by TIS11B (N = 834). Mann-Whitney test p values as Figure 2A. Boxplots depict median, 25th and 75th percentiles (box), and 5% and 95% confidence intervals (error bars). (E) Model showing additive effects of coding exon length and RBPs on mRNA localization propensity to TGs or the cytosol. Positive effect: (check), negative effect: (x) shown as in Figure 2I. (F) As in (D) for mRNA localization to the ER, stratified by mRNA length and bound RBPs. Bound by TIA1/L1 (N = 634). (G) As in (E) showing additive effects of mRNA length and RBPs on the mRNA localization propensity. (H) As in (D) for mRNAs localization to cytosol, stratified by mRNA length and bound RBPs.
Figure 4.
Figure 4.. Experimental validation of regulators of subcytoplasmic mRNA transcript distribution
(A) TG+ mRNAs are shown and are color-coded based on their change in compartment localization. No change (N = 508). (B) Length distribution of mRNAs from (A). Mann-Whitney test p values as in Figure 2A. (C) As in (B) but for protein size distribution. Boxplots depict median, 25th and 75th percentiles (box), and 5% and 95% confidence intervals (error bars). (D) As in (B) but for CDS exon length distribution. (E) As in Figure 3E but for mRNA features of TG+ mRNAs that change their localization upon TIS11B KO. (F) Schematic of mRNA reporter for validation of a 3′ UTR-bound RBP on mRNA localization. The GFP-THAP1 reporter mRNA contains MS2 hairpins as 3′ UTR, which bind to cotransfected MS2 coat protein (mCherry-tagged MCP). TIAL1-MCP fusion tethers TIAL1 to the reporter 3′ UTR. mC, mCherry. (G) Confocal live cell imaging of HeLa cells expressing the indicated constructs. Scale bars, 5 μm. (H) RNA-FISH (teal) of the GFP reporter mRNA from (F) in HeLa cells. GFP-SEC61B visualizes the rough ER (magenta). Representative images are shown. Scale bars, 5 μm. (I) Pearson’s correlation coefficients of fluorescence intensities at arrows in (H). (J) Quantification of (H) and (I). MCP (n = 26 cells), MCP-TIAL1 (n = 21). Horizontal line: median, error bars: 25th, 75th percentiles. Mann-Whitney test, ****p < 0.0001.
Figure 5.
Figure 5.. 3′ UTR-bound TIAL1 cooperates with the rough ER membrane environment to increase protein expression
(A) Protein abundance of mRNAs stratified by RBP binding. No RBP (N = 126), bound by TIS11B (N = 267), bound by TIA1/L1 (N = 232). Mann-Whitney test p values as in Figure 2A. Boxplots depict median, 25th and 75th percentiles (box), and 5% and 95% confidence intervals (error bars). (B) GFP protein expression in HeLa cells using the GFP-THAP1 reporter mRNA with and without TIAL1 tethering. Representative histograms are shown. Dotted lines: GFP-negative cells. (C) Quantification of (B) as mean ± SD of five independent experiments. t test for independent samples, ****p = 0.0003. (D) Quantification of mRNA level from (B) as mean ± SD of three independent experiments. t test for independent samples. (E) Schematic of GFP-THAP1 mRNA reporter to investigate the influence of subcellular mRNA localization on protein expression. MCP-SEC61B fusion localizes the reporter mRNA (as in Figure 4F) to the rough ER membrane, MCP localizes it to the cytosol. (F) Confocal live cell imaging of HeLa cells. Scale bars, 5 μm. (G) As in (B), but reporter mRNA was used with and without SEC61B tethering. (H) Quantification of (G) as mean ± SD of four independent experiments. t test for independent samples, **p = 0.0026. (I) Quantification of mRNA level from (G) as mean ± SD of three independent experiments. t test for independent samples, NS, not significant. (J) As in Figure 4F. Addition of prenylation signal (CAAX) localizes the TIAL1-bound reporter mRNA to the plasma membrane. In the absence of CAAX, the TIAL1-bound reporter mRNA localizes to the rough ER. (K) Confocal live cell imaging of HeLa cells. Scale bars, 5 μm. (L) As in (B) but the reporter mRNA was tethered with the indicated constructs. (M) Quantification of (L) as mean ± SD of four independent experiments. t test for independent samples, ****p < 0.0006, **p = 0.002. (N) Endogenous mRNAs bound by TIA1/L1 encode higher expressed proteins than mRNAs not bound by any RBP. The largest TIA1/L1-associated increase was observed for ER+ mRNAs. Mann-Whitney test p values as in Figure 2A.
Figure 6.
Figure 6.. Localization of cytosolic mRNAs to the rough ER membrane increases their protein expression
(A) Schematic of a GFP-THAP1 reporter mRNA bound by TIS11B to investigate localization-dependent GFP protein expression. MCP-TIS11B fusion localizes the mRNA reporter to the cytosol. TIS11B-MCP-SEC61B fusion localizes the mRNA reporter to the rough ER membrane. (B) Confocal live cell imaging of HeLa cells expressing constructs from (A). Scale bars, 5 μm. (C) As in Figure 5B. (D) Quantification of (C) as mean ± SD of four independent experiments. t test for independent samples, ****p < 0.0001, **p = 0.003. (E) Quantification of mRNA level in the experiment from (C). Shown is the mean ± SD of three independent experiments. t test for independent samples, *p = 0.037; NS, not significant.
Figure 7.
Figure 7.. Model
Model showing features of endogenous mRNAs with biased subcytoplasmic transcript distribution. See text for details. Horizontal arrow: no change.

References

    1. Hüttelmaier S, Zenklusen D, Lederer M, Dictenberg J, Lorenz M, Meng X, Bassell GJ, Condeelis J, and Singer RH. (2005). Spatial regulation of beta-actin translation by Src-dependent phosphorylation of ZBP1. Nature 438, 512–515. - PubMed
    1. Lécuyer E, Yoshida H, Parthasarathy N, Alm C, Babak T, Cerovina T, Hughes TR, Tomancak P, and Krause HM. (2007). Global analysis of mRNA localization reveals a prominent role in organizing cellular architecture and function. Cell 131, 174–187. - PubMed
    1. Moor AE, Golan M, Massasa EE, Lemze D, Weizman T, Shenhav R, Baydatch S, Mizrahi O, Winkler R, Golani O, et al. (2017). Global mRNA polarization regulates translation efficiency in the intestinal epithelium. Science 357, 1299–1303. - PMC - PubMed
    1. Tushev G, Glock C, Heumüller M, Biever A, Jovanovic M, and Schuman EM. (2018). Alternative 3′ UTRs modify the localization, regulatory potential, stability, and plasticity of mRNAs in neuronal compartments. Neuron 98, 495–511.e6. - PubMed
    1. Glock C, Biever A, Tushev G, Nassim-Assir B, Kao A, Bartnik I, Tom Dieck S, and Schuman EM. (2021). The translatome of neuronal cell bodies, dendrites, and axons. Proc. Natl. Acad. Sci. USA 118, e2113929118. - PMC - PubMed