. 2023 Dec 21;83(24):4633-4645.e9.
doi: 10.1016/j.molcel.2023.11.021.

High-throughput PRIME-editing screens identify functional DNA variants in the human genome

Affiliations

High-throughput PRIME-editing screens identify functional DNA variants in the human genome

Xingjie Ren et al. Mol Cell. .

Abstract

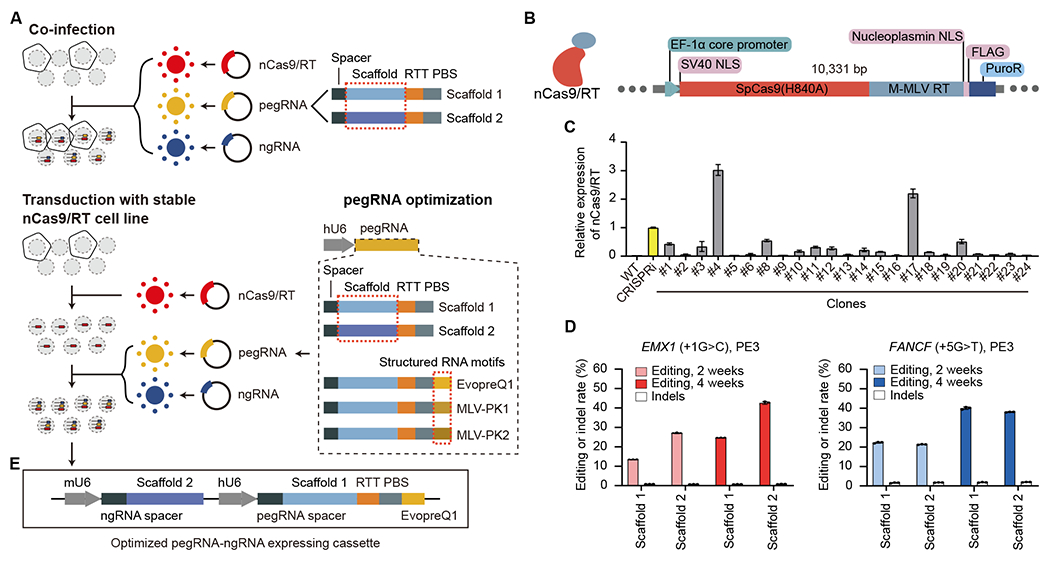
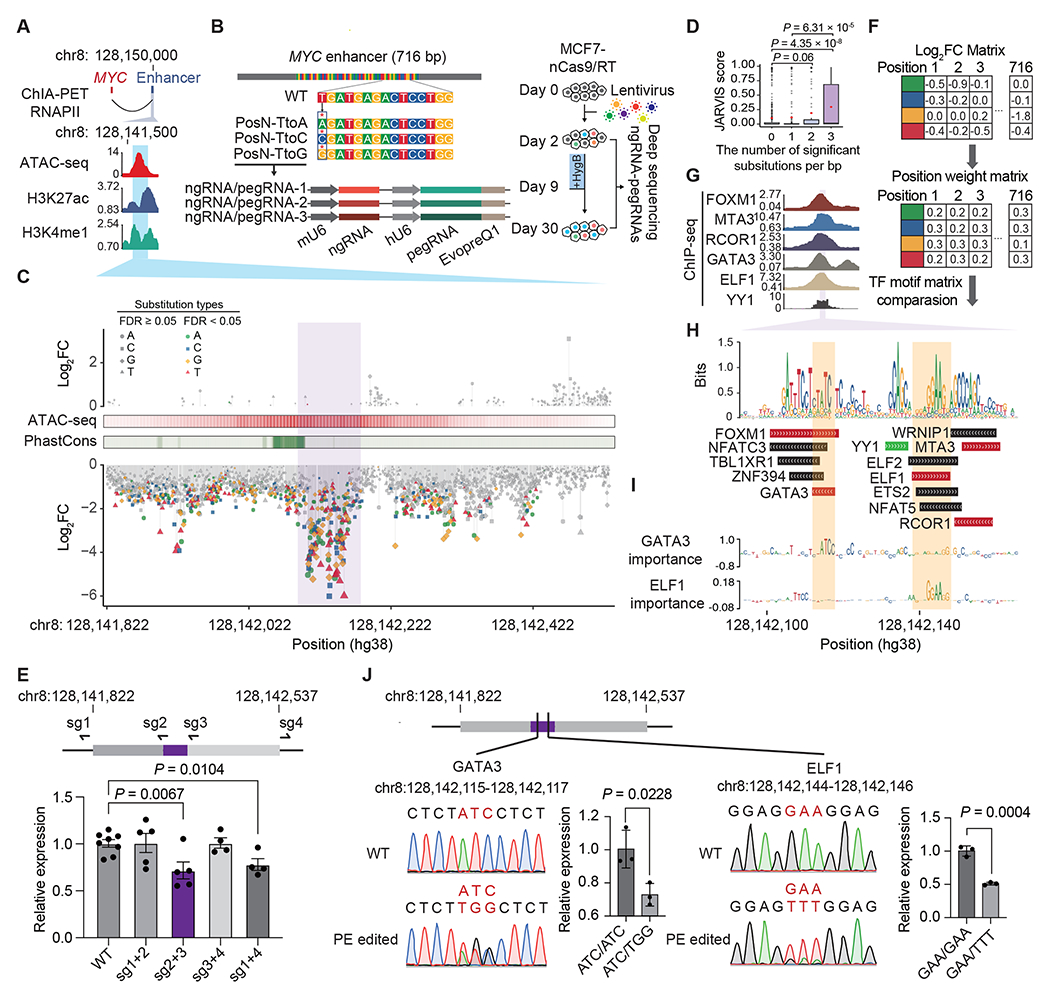
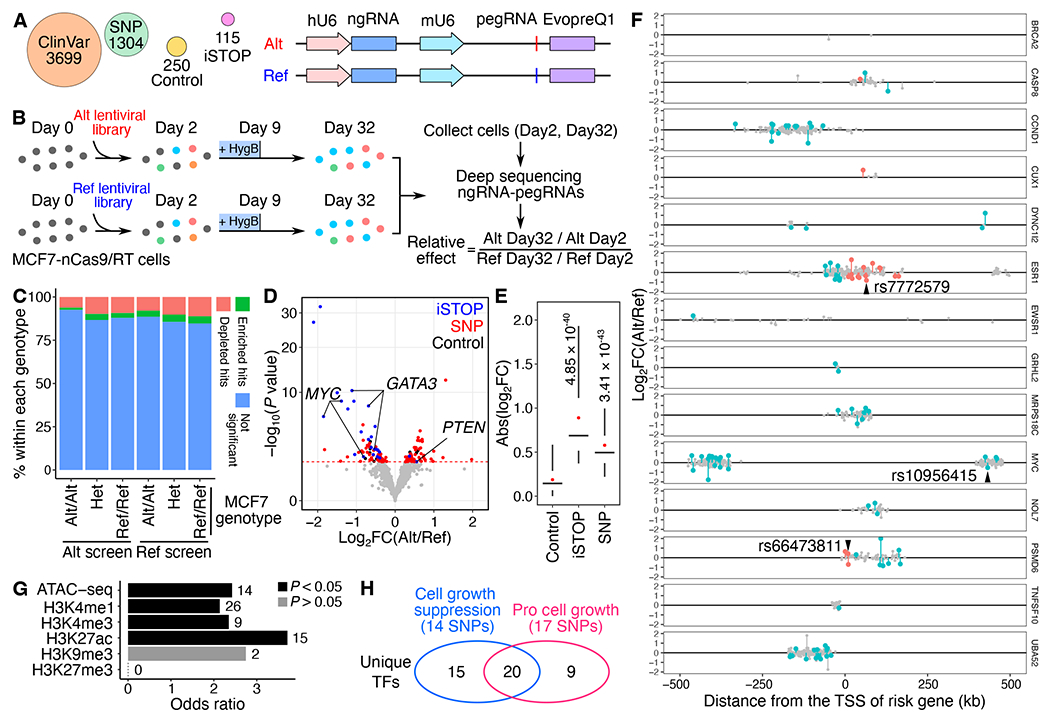
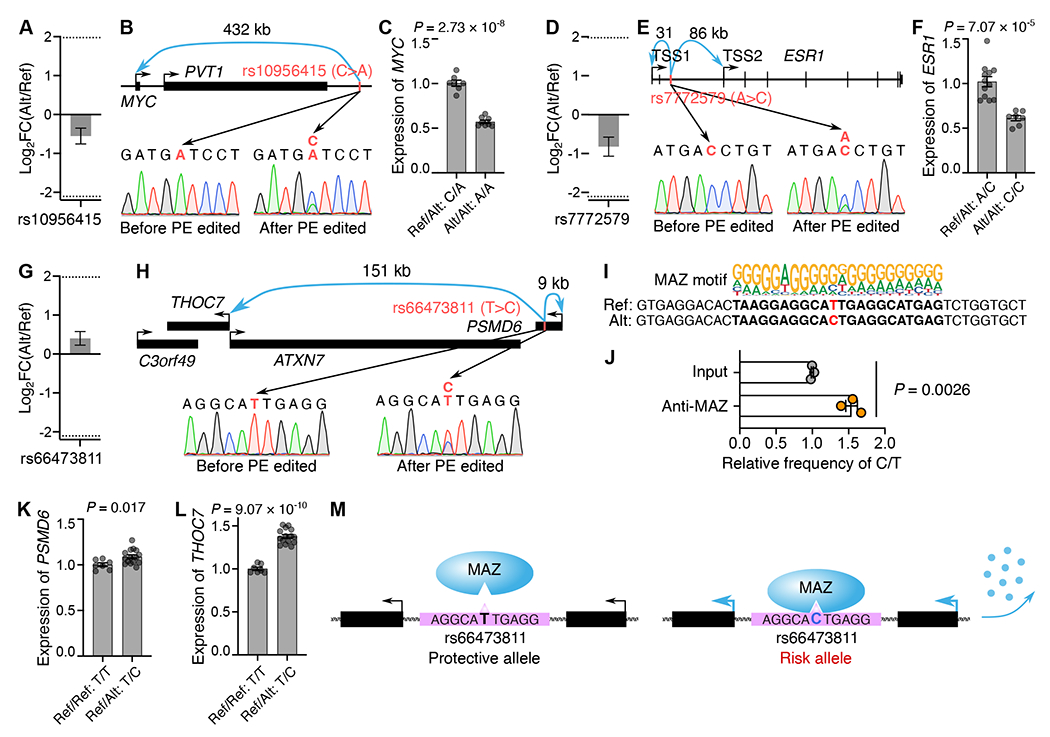
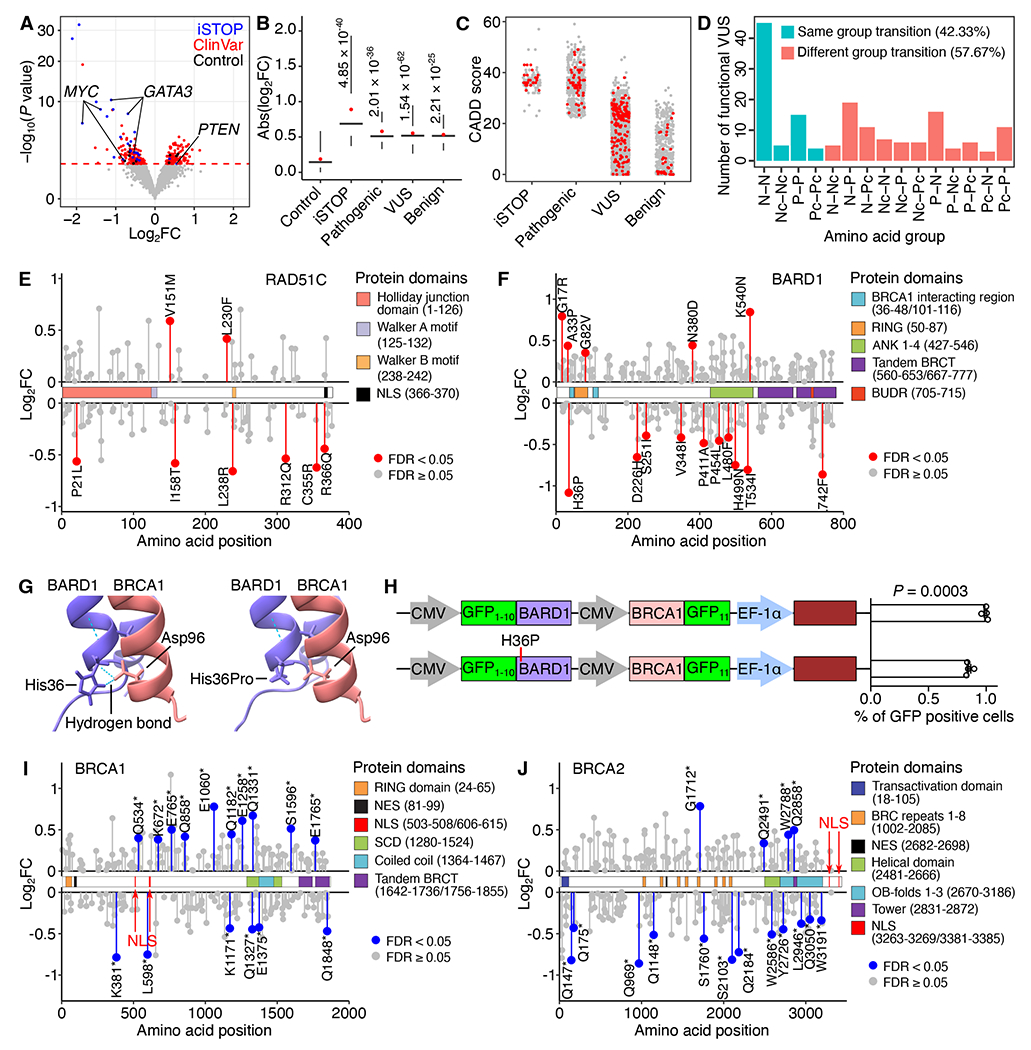
Despite tremendous progress in detecting DNA variants associated with human disease, interpreting their functional impact in a high-throughput and single-base resolution manner remains challenging. Here, we develop a pooled prime-editing screen method, PRIME, that can be applied to characterize thousands of coding and non-coding variants in a single experiment with high reproducibility. To showcase its applications, we first identified essential nucleotides for a 716 bp MYC enhancer via PRIME-mediated single-base resolution analysis. Next, we applied PRIME to functionally characterize 1,304 genome-wide association study (GWAS)-identified non-coding variants associated with breast cancer and 3,699 variants from ClinVar. We discovered that 103 non-coding variants and 156 variants of uncertain significance are functional via affecting cell fitness. Collectively, we demonstrate that PRIME is capable of characterizing genetic variants at single-base resolution and scale, advancing accurate genome annotation for disease risk prediction, diagnosis, and therapeutic target identification.

Keywords: disease variants; enhancer; high-throughput screens; prime editing; single-base resolution.


Conflict of interest statement

Declaration of interests X.R., H.Y., and Yin Shen have filed a patent application related to pooled prime-editing screens.

Figures

Figure 1.
Figure 1.. Optimizing PE efficiency in mammalian cells using lentiviral delivery.
(A) Optimizing PE efficiency in MCF7 cell lines. Top: co-infecting three different viruses to deliver PE machinery. Bottom: pegRNA and ngRNA viral infection of clonal MCF7 line stably expressing nCas9 and M-MLV RT. (B) Lentiviral construct for generating nCas9/RT expressing MCF7 clones. PuroR, Puromycin resistance gene. (C) RT-qPCR analysis showing the relative expression of nCas9/RT in different clones, normalized to the dCas9 expression of an established CRISPRi iPSC line (Yellow). Error bars represent the s.e.m. (D) The editing efficiency and indel rate for EMX1 and FANCF loci at 2-week and 4-week after PE installation using two different RNA scaffolds. Error bars represent the s.d. (E) Improved vector for expression of pegRNA and ngRNA for PRIME. RTT: reverse transcription template. PBS: primer binding site. See also Figure S1.
Figure 2.
Figure 2.. Functional characterization of a MYC enhancer by single-base resolution analysis using PRIME.
(A) The target enhancer is downstream of MYC. The blue area indicates the region selected for PRIME. (B) Diagram showing the design of single-base resolution analysis screening at the 716 bp enhancer. Each nucleotide was subjected to substitution with three nucleotides by PE. Each substitution event was covered by three uniquely designed pegRNA/ngRNA pairs. (C) Log2(fold change) of each substitution at each base pair ordered by their genomic locations. Mutations with a significant effect on cell fitness are colored. ATAC-seq signals and conservation scores calculated by PhastCons are shown. The purple area indicates the core enhancer region. (D) JARVIS scores for base pairs with different numbers of significant substitutions. Box plots indicate median, IQR, Q1 – 1.5 × IQR, and Q3 + 1.5 × IQR. Outliers are shown as gray dots. Mean values are shown as red dots. (E) Design of sgRNAs for deleting distinct regions of the MYC enhancer (Top) and MYC expression levels in different regional deletion clones (Bottom). (F) The creation of a functional PWM for identifying potential TF binding sites. (G) ChIP-seq signals of 6 TFs in MCF7. The purple region indicates the core enhancer region. (H) The sequence logo plot for the core enhancer region generated by the functional PWM and the matched TF binding sites. The TF binding supported by ChIP-seq data in G are labeled in red. The YY1 (green) binding is predicted by Avocado. (I) Dense tracks showing BPNet model-derived nucleotide importance scores for GATA3 and ELF1 binding sites. (J) The impact of mutations in GATA3 and ELF1 motifs measured by MYC expression. For E and J, dots show individual replicate values and error bars represent s.e.m. P values in D, E and J were calculated by two-tailed two-sample t-test. See also Figure S2 and Table S1.
Figure 3.
Figure 3.. PRIME reveals functional SNPs associated with breast cancer.
(A) Alt and Ref library design overview. For each variant, pegRNA/ngRNA pairs introducing either the Alt or Ref allele were designed. (B) Workflow of PRIME with Alt and Ref libraries. MCF7-nCas9/RT cells were infected with either lentiviral library. The relative effect of each variant was determined based on its relative impact on cell growth between Alt versus Ref alleles. (C) The percentage of significant hits (FDR < 0.05) identified from Alt and Ref screens for Alt/Alt, Het, and Ref/Ref genotypes in MCF7. (D) The functional SNPs (red) with either a positive or a negative impact on cell growth were determined by their relative effect in the Alt versus Ref screens. Blue dots represent significant iSTOPs, and black dots represent controls. The red dashed line indicates 0.05 FDR. (E) Absolute effects of identified functional iSTOPs and SNPs are higher than the effects of negative controls (P values were calculated by two-tailed two-sample t-test). Box plots indicate the median, IQR, Q1 – 1.5 × IQR, and Q3 + 1.5 × IQR. Red dots indicate the mean. (F) The genomic distance of SNPs tested at each risk locus relative to each gene’s TSS. Red dots are functional SNPs within gene bodies, blue dots are functional SNPs in distal regions, and gray dots are SNPs with non-significant effects. Three selected SNPs for validation were labeled. (G) Relative enrichment of genomic features for identified functional SNPs (P values were calculated by two-tailed Fisher’s exact test). The numbers of SNPs overlapping each genomic feature are labeled next to each bar. (H) Venn diagram showing the numbers of unique transcription factors (TFs) with differential binding sites centered on functional SNPs. The numbers of SNPs that alter TF binding sites are shown in the parentheses. See also Figure S3, Tables S2 and S3.
Figure 4.
Figure 4.. Functional validation of PRIME identified functional SNPs.
(A, D, G) The relative effect (Alt/Ref) of rs10956415, rs7772579, rs66473811 on MCF7 cell growth from PRIME. Error bars indicate s.e. (B, E, H) The genomic landscapes and sequences before and after PE for rs10956415, rs7772579 and rs66473811. (C) The relative expression of MYC in PE edited clones (Ref/Alt: C/A, n=7) and control clones (Alt/Alt: A/A, n=8). (F) The relative expression of ESR1 in PE edited clones (Ref/Alt: A/C, n=12) and control clones (Alt/Alt: C/C, n=7). (I) The MAZ binding motif at rs66473811 locus. (J) Relative enrichment of MAZ binding at Alt (C) and Ref (T) alleles by ChIP and targeted sequencing (n=3 clones). (K, L) Relative expression of PSMD6 and THOC7 in control clones (Ref/Ref: T/T, n=7) and PE edited clones (Ref/Alt: T/C, n=15). (M) An illustration of T>C substitution increasing MAZ binding at the rs66473811 locus, upregulating PSMD6 and THOC7 expression, and promoting MCF7 growth. For C, F, and J-L, data are displayed in mean with s.e.m., P values were calculated by two-tailed two-sample t-test, and dots show individual replicate values. See also Figure S4.
Figure 5.
Figure 5.. Functional clinical variants identified using PRIME.
(A) Functional clinical variants (red) were determined by relative effects on cell fitness between Alt and Ref alleles. Blue dots represent significant iSTOPs, and black dots represent negative controls. The red dashed line indicates 5% FDR. (B) Effect sizes of identified functional iSTOPs and clinical variants are larger than that of negative controls (P values were calculated by two-tailed two-sample t-test). Box plots indicate the median, IQR, Q1 – 1.5 × IQR, and Q3 + 1.5 × IQR. Red dots indicate the mean. (C) CADD scores for iSTOPs and clinical variants. (D) Number of identified functional VUS causing each amino acid group transition. (N, Nonpolar; P, Polar; Pc, Positively charged; Nc, Negatively charged). (E, F) Lollipop plots of VUS in RAD51C and BARD1 mapped to their canonical isoforms. The identified functional VUSs are labeled in red. (G) The AlphaFold predicted protein structure of the BARD1 and BRCA1 complex. Two hydrogen bonds were identified between His36 in BARD1 and Asp96 in BRCA1, but lost following the BARD1 His36Pro mutation. (H) The percentage of GFP positive cells representing BARD1 and BRCA1 interactions by the split GFP system. The mCherry reporter was used to normalize the transfection rate. Data are displayed in mean with s.e.m. P values were calculated by two-tailed two-sample t-test. Dots show individual replicate values. (I, J) Lollipop plots of the nonsense variants in BRCA1 and BRCA2 mapped to their canonical isoforms. The identified significant hits are labeled in blue. See also Figure S5 and Table S2.

Update of

References

    1. Taliun D, Harris DN, Kessler MD, Carlson J, Szpiech ZA, Torres R, Taliun SAG, Corvelo A, Gogarten SM, Kang HM, et al. (2021). Sequencing of 53,831 diverse genomes from the NHLBI TOPMed Program. Nature 590, 290–299. 10.1038/s41586-021-03205-y. - DOI - PMC - PubMed
    1. French JD, and Edwards SL (2020). The Role of Noncoding Variants in Heritable Disease. Trends Genet 36, 880–891. 10.1016/j.tig.2020.07.004. - DOI - PubMed
    1. Wunnemann F, Fotsing Tadjo T, Beaudoin M, Lalonde S, Lo KS, Kleinstiver BP, and Lettre G (2023). Multimodal CRISPR perturbations of GWAS loci associated with coronary artery disease in vascular endothelial cells. PLoS Genet 19, e1010680. 10.1371/journal.pgen.1010680. - DOI - PMC - PubMed
    1. Canver MC, Smith EC, Sher F, Pinello L, Sanjana NE, Shalem O, Chen DD, Schupp PG, Vinjamur DS, Garcia SP, et al. (2015). BCL11A enhancer dissection by Cas9-mediated in situ saturating mutagenesis. Nature 527, 192–197. 10.1038/nature15521. - DOI - PMC - PubMed
    1. Shalem O, Sanjana NE, and Zhang F (2015). High-throughput functional genomics using CRISPR-Cas9. Nat Rev Genet 16, 299–311. 10.1038/nrg3899. - DOI - PMC - PubMed

Publication types