. 2024 Mar 6;112(5):835-849.e7.
doi: 10.1016/j.neuron.2023.11.023. Epub 2023 Dec 21.

D1 and D2 medium spiny neurons in the nucleus accumbens core have distinct and valence-independent roles in learning

Affiliations

D1 and D2 medium spiny neurons in the nucleus accumbens core have distinct and valence-independent roles in learning

Jennifer E Zachry et al. Neuron. .

Abstract

At the core of value-based learning is the nucleus accumbens (NAc). D1- and D2-receptor-containing medium spiny neurons (MSNs) in the NAc core are hypothesized to have opposing valence-based roles in behavior. Using optical imaging and manipulation approaches in mice, we show that neither D1 nor D2 MSNs signal valence. D1 MSN responses were evoked by stimuli regardless of valence or contingency. D2 MSNs were evoked by both cues and outcomes, were dynamically changed with learning, and tracked valence-free prediction error at the population and individual neuron level. Finally, D2 MSN responses to cues were necessary for associative learning. Thus, D1 and D2 MSNs work in tandem, rather than in opposition, by signaling specific properties of stimuli to control learning.

Keywords: aversion; calcium imaging; fear conditioning; motivation; reinforcement learning; striatum.


Conflict of interest statement

Declaration of interests The authors declare no competing interests.

Figures

Figure 1.
Figure 1.. D1 and D2 MSNs do not track stimulus valence.
(A) Cre-dependent GCaMP6f (AAV5.hsyn.flex.CGaMP6f) was expressed in D1 MSNs (D1-cre mice) or D2 (A2A-cre mice) MSNs. (right) Example of GCaMP6f expression in NAc core. (B) D1 MSNs showed a positive response to sucrose retrieval in a positive reinforcement operant task (two-tailed independent sample t-test, t45 = 2.897, p = 0.0058, n = 5 mice). Dark grey dots are individual trials across all animals, light grey dots are averaged responses for each animal. (C) D2 MSNs showed a decrease to sucrose retrieval in the same task (two-tailed independent sample t-test, t60 = 6.287, p < 0.0001, n = 5 mice). (D) D1 MSNs showed an intensity-dependent positive response to unsignaled shock (nested ANOVA, F(1,39) = 6.53, p = 0.0159, n = 5 mice). (E) D2 MSNs showed an intensity-dependent positive response to unsignaled shock (nested ANOVA, F(1,47) = 5.04, p = 0.031, n = 6 mice). (F) Intracranial self-stimulation (ICSS) task design. An excitatory opsin (ChR2; AAV5.Ef1a.DIO.hChR2) or a control vector (eYFP; AAV5.hSyn1.eYFP) was expressed in D1 MSNs or D2 MSNs in the NAc core. Nose pokes resulted in laser illumination (14Hz, 2s, 8mW, 470nM). Viral expression of ChR2 in the NAc core (G) Mice were trained to nose poke for optical stimulation of either D1 MSNs or D2 MSNs over four days. (H) D1-Cre (D1 MSN) and A2A-Cre (D2 MSN) mice showed a preference for the active nose poke as compared to eYFP controls (repeated measures ANOVA, trial × group interaction F(6,42) = 3.168, p = 0.0118). (I) D1-cre (n = 5 mice) and A2A-Cre (D2 MSNs, n = 7 mice) showed a greater percentage of total responses on the active operanda as compared to the eYFP controls (n = 5 mice, one-way ANOVA, F(2,14) = 8.955, p = 0.0031; Dunnett’s post-hoc eYFP versus D1, p = 0.0360; eYFP verses D2, p = 0.0016). (J) Training-dependent increase in responses in D1-Cre and A2A-Cre mice as compared to eYFP (one-way ANOVA, F(2,14) = 4.602, p = 0.0291; Dunnett’s post-hoc eYFP versus D1, p = 0.0248; eYFP verses A2A, p = 0.0485). Data represented as mean ± S.E.M.; * p < 0.05; ** p < 0.01, ****p < 0.0001.
Figure 2.
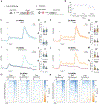
Figure 2.. D2 MSN responses to predictive cues scale with learning, while D1 MSN responses do not change.
(A) A discriminative cue (Sd) indicated that responses on a fixed-ratio 1 schedule resulted in sucrose delivery. (B) Mice acquired this task (>60 responses on the active operanda). (C) Nearly all responses were made during the cue period, indicating that mice learned the value of this cue (two-tailed independent sample t-test, t11 = 11.23, p < 0.0001, n = 12 mice; chance = 50%). (D) Mice responded during an Sd to prevent shock presentation. (E) Mice avoided almost all possible shocks. (F) Almost all responses were made during the cue period, indicating that mice learned the cue value (two-tailed independent sample t-test, t9 = 14.68, p < 0.0001, n = 10 mice; critical value = 75.1%). (G) D1 MSNs showed a response to the Sd that signaled positive reinforcement. This response did not change with training (nested ANOVA, F(1,176) = 0.63, p = 0.427, n = 6 mice). Dark grey dots are individual trials across all animals, light grey dots are the first response in each session for each animal. (H) Heatmap of D1 MSN responses pre-training and post-training during negative reinforcement. All heatmaps are individual trials ordered by response magnitude to the cue. (I) D1 MSNs showed a positive response to the Sd signaling negative reinforcement that did not change with experience (nested ANOVA F(1,91) = 1.21, p = 0.2747, n = 5 mice). (J) Heatmap of D1 MSN responses pre-training and post-training during negative reinforcement. (K) D2 MSNs showed an increase in response to the Sd signaling positive reinforcement between pre- and post-training (nested ANOVA F(1,166) = 16.38, p < 0.0001, n = 6 mice). (L) Heatmap of D2 MSN responses. (M) D2 MSNs showed a learning-dependent increase to the Sd signaling negative reinforcement (nested ANOVA F(1,88) = 5.35, p = 0.0234, n = 5 mice). (N) Heatmap of trial responses pre-training and post-training during negative reinforcement. Data represented as mean ± S.E.M. * p < 0.05, ** p < 0.01, **** p < 0.0001.
Figure 3.
Figure 3.. D2 MSN responses to cues increase over learning, while D1 MSN responses do not change, in Pavlovian tasks
(A) (i) Mice received a five second cue followed by a half-second shock in a Pavlovian fear conditioning task. (ii) During extinction, the cue was presented for five seconds but the shock was not delivered. (B) Freezing across trials during fear conditioning session 1 (FC1), fear conditioning session 4 (FC4), and extinction session 4 (EXT4) (repeated measures ANOVA, trial × group interaction F(5.017,55.19) = 2.879, p = 0.0221). (C) D1 MSN response to the cue in the first (FC1) and last (FC4) fear conditioning session. (D, E) D1 MSNs showed no difference in response to the cue (nested ANOVA, F(1,71) = 0.02, p = 0.8977, n = 6 mice) or the shock (nested ANOVA F(1,71) = 1.73, p = 0.1938, n = 6 mice) over sessions. Dark grey dots are individual trials across all animals, light grey dots are averaged responses for each animal. (F) D2 MSN response to the cue in FC1 and FC4. (G) D2 MSNs showed an increase in response to the cue over sessions (nested ANOVA, F(1,71) = 11.28, p = 0.0014, n = 6 mice). (H) The peak responses to the shock in D2 MSNs normalized to the pre-trial baseline (nested ANOVA, F(1,71) = 0.42, p = 0.5218, n = 6 mice). (I) D1 MSN cue and shock responses in the last fear conditioning session (FC4) compared to the last session of extinction (data from FC4, replotted from panel C). (J) There was no change in the D1 MSN response to the cue following extinction (nested ANOVA F(1,71) = 0, p = 0.9907, n = 6 mice). (K) D1 MSN responses to shock period. In FC4 the shock was presented and in extinction (EXT4) it was not (nested ANOVA, F(1,71) = 68.59, p < 0.0001, n = 6 mice). (L) D2 MSN response to the cue and shock in FC4 as compared to extinction (FC4 data plotted from panel F). (M) There was a decrease in the cue response following extinction (nested ANOVA, F(1,71) = 16.32, p = 0.0002, n = 6 mice). (N) The response during the shock period was also reduced (nested ANOVA, F(1,71) = 56.31, p < 0.0001, n = 6 mice). In FC4 the shock was presented and in extinction (EXT4) it was not. (O, P) Heatmap of D1 MSN (O) and D2 MSN (P) responses to task parameters ordered by response magnitude to cue (from largest at top to smallest at bottom) during early (FC1) and late (FC4) fear conditioning and late fear extinction (EXT4). Data represented as mean ± S.E.M. *** p < 0.001, **** p < 0.0001. [fear conditioning session 1 (FC1); fear conditioning session 4 (FC4); extinction session 4 (EXT4)].
Figure 4.
Figure 4.. D2 MSN responses to stimuli are modulated by prior predictions.
(A) Mice were given ad libitum access to sucrose in the delivery port and signals were analyzed around the first lick in the first lick bout. (B) When sucrose was not predicted, D2 MSN response was increased (independent sample t-test, t25 = 4.41, p = 0.0002, n = 4 mice), rather than decreased (Fig 1C). We next determined if D1 MSN or D2 MSN responses to footshocks were changed based on prediction. (C) Signals were z-scored around the baseline preceding the onset of the shock in the first two trials of fear conditioning session 1 (FC1) when the mouse experiences the cue and the shock for the first and second time, and fear conditioning session 4 (FC4) when the mouse has extensive experience with the cue-shock association. Dark grey dots are trial 1 response, light grey dots are trial 2 response. There was no effect on D1 MSNs responses to the shock under these conditions (nested ANOVA F(1,23) = 0.74, p = 0.4055, n = 6 mice). (D) D2 MSN responses to the footshock became smaller as the prediction between cue and shock became stronger (nested ANOVA, F(1,23) = 18.22, p = 0.0011, n = 6 mice). (E) The likelihood of a cue-shock pairing was manipulated (shock occurs 10% of the trials in the session or 75% of the trials in the session). (F, left) Fiber photometry trace from D2 MSNs during the shock responses depending on the probability of the prediction. (F, right) D2 MSNs showed an increase in the cue response (paired t-test, t4 = 4.540, p = 0.0105, n = 5 mice) and decrease in the magnitude of the shock response (paired t-test, t4 = 3.117, p = 0.0356, n = 5 mice) with greater predictability of the shock outcome. Data represented as mean ± S.E.M. * p < 0.05, *** p < 0.001. [fear conditioning session 1 [FC1]; fear conditioning session 4 [FC4].
Figure 5.
Figure 5.. D2 MSN recruitment is increased over learning and individual D2 MSNs respond to both the cue and the shock.
(A) D1 and D2 MSN responses were recorded via cell-type specific expression of GCaMP6m as described. A GRIN lens was implanted above the NAc core for optical access. (B) Fear conditioning. Mice received a ten-second cue followed by a 0.5s shock. (C) Freezing responses increased over training (repeated measures ANOVA, trial × group interaction F(3.990,35.91) = 4.212, p = 0.0068). Session 1 (FC1), Session 4 (FC4). (D) D1 MSNs responses across detected cells (157 cells in FC1, 180 cells in FC4). (E) There was a moderate decrease in the peak response to the cue in the last session as compared to the first (independent sample t-test, t335 = 2.505, p = 0.0127, n = 5 mice). (F) The shock response did not change (independent sample t-test, t335 = 0.6697, p = 0.5035, n = 5 mice). (G, H) Percentage of the total D1 MSNs detected in each session that increased (positive), decreased (negative), or showed no response (no response) to the cue or shock in the first (G, FC1) or last session (H, FC4). D1 MSN responses did not change over learning. (I) D2 MSNs responses (107 cells in FC1, 111 cells in FC4). (J) D2 MSN responses to the cue were increased over sessions (independent sample t-test, t216 = 3.435, p = 0.0007, n = 5 mice). (K) No difference in the shock response (independent sample t-test, t216 = 0.71, p = 0.4779, n = 5 mice). (L, M) Percentage of D2 MSNs that increased (positive), decreased (negative), or did not respond (no response) to the cue and the shock in the first session (L, FC1) and the last (M, FC4). The number of D2 MSNs that responded to the cue changed over learning. Data represented as mean ± S.E.M. * p < 0.05, *** p < 0.001. [fear conditioning session 1 [FC1]; fear conditioning session 4 [FC4].
Figure 6.
Figure 6.. D2 MSNs, but not D1 MSNs, change dynamically over learning in both the pattern and timing of responses to learned cues.
(A) Neural trajectories summarizing the activity of D1-MSNs in fear conditioning session 1 [FC1, (i), n=157 neurons], D1-MSNs in fear conditioning session 4 [FC4, (ii), n=180 neurons], D2-MSNs in FC1 [(iii), n=107 neurons], and D2-MSNs in FC4 [(iv), n=111 neurons]. Each time point is depicted as an arrow pointing in the direction of the next time point. The size of each arrow is proportional to the delay until the next timepoint (i.e., how fast the activity is moving along the trajectory with large arrows depicting more rapid changes). The pre-cue baseline period is colored light grey, the cue period is color-coded (D2-MSN/FC1: red, D2-MSN/FC4: orange, D1-MSN/FC1: dark blue, D1-MSN/FC4: light blue), and the shock period is colored dark grey. As mice learn the cue-footshock contingency, D2 MSN cue responses, but not D1 MSN responses, become more variable. (B) D2 MSNs were categorized based on observed activity patterns in the NAc during the initial fear conditioning session (FC1) in the following categories: (i) response only to the cue; (ii) response only to the shock (iii) response both to the cue and shock. (C) In D1 MSNs, most of the cells only responded to the shock during the initial fear conditioning session (FC1). (D) The D1 MSN cell recruitment to the cue and the shock was similar in the last fear conditioning session (FC4), with a majority of cells responding only to the shock. (E) In D2 MSNs, initially (on FC1) only a small percentage of cells responded to both the cue and shock. (F) In FC4, a majority of D2 MSNs responded to both the cue and shock. (G) D2 MSNs were recorded on the first session (FC1) and cells detected during this session were longitudinally co-registered with cells in the last session (FC4) based on activity during each session. (H) Most of the cells that only responded to the cue in FC1 were not detected as active during the final fear conditioning session (FC4, only 13% co-registered). The majority of D2 MSNs that responded to the shock (either shock alone, or both cue and shock) were re-recruited in FC4. (I) Heatmaps showing cue responses for fear conditioning session 1 and 4 ordered by tge tune of response following cue presentation. (J) Histogram of event numbers for each second of the cue period, superimposed on the z-scored averaged calcium responses. Event analysis showed that the number of D2 MSN events within the cue period increased with learning (chi square=34.32, p<0.0001) and the amplitude of those events became larger as well [(i) the whole cue period, unpaired t-test, t718 = 4.26, p < 0.0001, n = 239-481 events]. When clustered based on the timing of the response the peak event amplitude was larger in FC4 during the early segment ((ii) from the cue onset to 3 sec; unpaired t-test, t301 = 3.76, p = 0.0002, n = 78-225 events) but not during the middle [(iii) 3.5 sec to 6.5 sec, unpaired t-test, t169 = 1.13, p = 0.26, n = 57-114 events] or the late [(iv) 7 sec to the cue offset, unpaired t-test, t191 = 1.33, p = 0.18, n = 73-120 events] segments of the cue period. (K) The event onset was earlier in FC4 compared to FC1 (unpaired t-test, t718 = 3.61, p = 0.0003, n = 239-481 events). Data represented as mean ± S.E.M., *** p < 0.001, **** p < 0.001, ns = not significant. [fear conditioning session 1 [FC1]; fear conditioning session 4 [FC4].
Figure 7.
Figure 7.. Optogenetic inhibition of D2 MSN responses during the cue slows associative learning.
(A) The inhibitory opsin halorhodopsin (AAV5.hSyn.DIO.eNpHR3.0) was selectively expressed in D1 or D2 MSNs. Representative histology. (B) A laser (constant, 5s, 8mW, 590nM) was illuminated at the time of cue onset. (C) When D2, but not D1 MSNs, were inhibited mice developed a freezing response at a slower rate (RM ANOVA trial × group interaction F(2,18) = 8.17, p = 0.0030; multiple comparison D2 MSN versus eYFP session 3, p = 0.0005). (D) D2 MSN inhibition reduced freezing during the 3 training trials as compared to eYFP animals (one-way ANOVA F(2,13) = 7.52, p = 0.0067; Bonferroni’s post-hoc eYFP versus D1, p > 0.9999; eYFP verses A2A, p = 0.018). Data represented as mean ± S.E.M. * p < 0.05, ** p < 0.01.

References

    1. Cardinal RN (2006). Neural systems implicated in delayed and probabilistic reinforcement. Neural Networks 19, 1277–1301. 10.1016/j.neunet.2006.03.004. - DOI - PubMed
    1. Green L, and Myerson J (2004). A Discounting Framework for Choice With Delayed and Probabilistic Rewards. Psychol Bull 130, 769–792. 10.1037/0033-2909.130.5.769. - DOI - PMC - PubMed
    1. Avanzi M, Uber E, and Bonfà F (2004). Pathological gambling in two patients on dopamine replacement therapy for Parkinson’s disease. Neurol Sci 25, 98–101. 10.1007/s10072-004-0238-z. - DOI - PubMed
    1. Chang C-J, Guo W, Zhang J, Newman J, Sun S-H, and Wilson M (2021). Behavioral clusters revealed by end-to-end decoding from microendoscopic imaging. bioRxiv, 2021.04.15.440055. 10.1101/2021.04.15.440055. - DOI
    1. Dodd ML, Klos KJ, Bower JH, Geda YE, Josephs KA, and Ahlskog JE (2005). Pathological Gambling Caused by Drugs Used to Treat Parkinson Disease. Archives of Neurology 62, 1377–1381. 10.1001/archneur.62.9.noc50009. - DOI - PubMed

Substances

LinkOut - more resources