. 2024 Jan 16;5(1):101350.
doi: 10.1016/j.xcrm.2023.101350. Epub 2023 Dec 21.

Microbiome preterm birth DREAM challenge: Crowdsourcing machine learning approaches to advance preterm birth research

Affiliations

Microbiome preterm birth DREAM challenge: Crowdsourcing machine learning approaches to advance preterm birth research

Jonathan L Golob et al. Cell Rep Med. .

Abstract

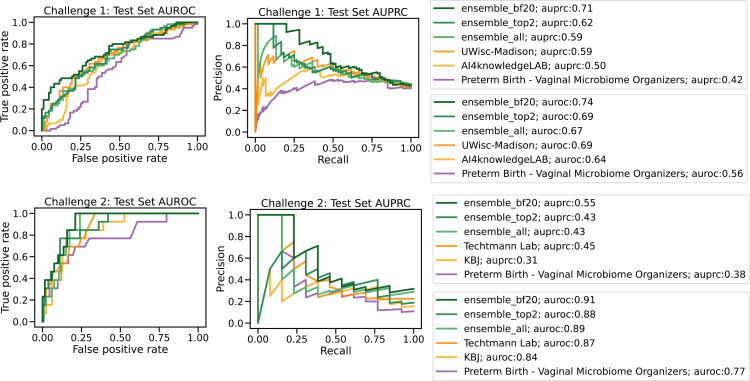
Every year, 11% of infants are born preterm with significant health consequences, with the vaginal microbiome a risk factor for preterm birth. We crowdsource models to predict (1) preterm birth (PTB; <37 weeks) or (2) early preterm birth (ePTB; <32 weeks) from 9 vaginal microbiome studies representing 3,578 samples from 1,268 pregnant individuals, aggregated from public raw data via phylogenetic harmonization. The predictive models are validated on two independent unpublished datasets representing 331 samples from 148 pregnant individuals. The top-performing models (among 148 and 121 submissions from 318 teams) achieve area under the receiver operator characteristic (AUROC) curve scores of 0.69 and 0.87 predicting PTB and ePTB, respectively. Alpha diversity, VALENCIA community state types, and composition are important features in the top-performing models, most of which are tree-based methods. This work is a model for translation of microbiome data into clinically relevant predictive models and to better understand preterm birth.

Keywords: 16S harmonization; DREAM challenge; crowdsourced; machine learning; microbiome; predictive modeling; preterm birth; vaginal microbiome.


Conflict of interest statement

Declaration of interests S.V.L. is a board member at, holds stock in, and consults for Siolta Therapeutics. She also consults for the Atria Academy of Science and Medicine and for Sanofi. J.C.C. is co-founder of PrecisionProfile and OncoRx Insights. N.Aghaeepour. is a member of the scientific advisory boards of January AI, Parallel Bio, Celine Therapeutics, and WellSim Biomedical Technologies and is a paid consultant for Mara BioSystems. J.G. and M.S. have filed a patent related to the phylotype generation process.

Figures

None
Graphical abstract
Figure 1
Figure 1
Study design and challenge overview and data harmonization (A) Left: depiction of the assembled training and test datasets, harmonization of the data, transformation into feature tables, and the outcomes posed to the participating teams. Right: two sub-challenges, the global locations of the participating teams, the number of participants per sub-challenge, assessment process, and analysis of the better-performing models. (B) Uniform manifold approximation and projection (UMAP) ordination plots of the aggregated data before (left) and after (right) harmonization where each dot represents one vaginal microbiome sample colored by study. (C) Violin plots of Shannon alpha diversity by trimester before (top) and after (bottom) harmonization stratified by study.
Figure 2
Figure 2
Data visualization of microbiome features by outcome (A) UMAP ordination plots of the vaginal microbiome colored by outcome. (B) Violin plot of diversity before (left) and after (right) harmonization stratified and colored by outcome. (C) Alluvial plot of community state type (CST) frequencies across time stratified by birth outcome.
Figure 3
Figure 3
Prediction accuracy of models against sequestered validation data from two independent studies not available to modeling teams Bootstrapped area under the receiver operator characteristic (AUROC) curves and Bayes factors for (A) sub-challenge 1 and (B) sub-challenge 2 of the best-performing model of each team for each sub-challenge and the organizer’s baseline model (purple) against bootstrapped data (n = 1,000) with replacement from the two validation studies harmonized post hoc into the same feature sets. Bootstrapping was done by pregnancy, not specimen. Left column: box-and-whisker plots of the bootstrapped AUROC values; middle column: the Bayes factors when compared to the top-performing model; right column: Bayes factors when comparing against the organizer’s model. Yellow represents the two best-performing models for each sub-challenge. Blue represents models with a Bayes factor ≤20 when compared to the top-performing model.
Figure 4
Figure 4
Feature sets and individual compositional features used by top-performing models Top-performing models here are defined a bootstrapped area under receiver operator curve greater than 0.64 or 0.8, respectively, for sub-challenge 1 or 2, further limited to models that could make a prediction in less than 10 s on a twelve-core AMD Ryzen 3900X processor. (A) Feature tables used by the top-performing models for sub-challenge 1 (left) and sub-challenge 2 (right) to make their predictions of preterm birth and early preterm birth, respectively. Filled in blocks indicate that this feature table (by row) was used by a given model (columns) to make the prediction. Unfilled blocks are for feature tables that, when randomized, did not affect the prediction. (B) For the six sub-challenge 2 models evaluated by feature permutation that also made use of phylotypes at 0.1 distance, 32 of the phylotypes were used by all 6 models and 73 were used by 5 of the six models (right Venn diagram). 32 phylotypes used by all six models are grouped by the closest species (left) for that phylotype.
Figure 5
Figure 5
Ensemble model results For (A) sub-challenge 1 and (B) sub-challenge 2, the AUROC (left) curve and area under the precision-recall curve (AUPRC; right) of three ensemble models (“ensemble_top2”: top two best-performing models, “ensemble_top2”: models with Bayes factor less than 20, and “ensemble_all”: all models), as well as first place, second place, and baseline models, colored by model.

Update of

References

    1. Blencowe H., Cousens S., Oestergaard M.Z., Chou D., Moller A.-B., Narwal R., Adler A., Vera Garcia C., Rohde S., Say L., Lawn J.E. National, regional, and worldwide estimates of preterm birth rates in the year 2010 with time trends since 1990 for selected countries: a systematic analysis and implications. Lancet. 2012;379:2162–2172. - PubMed
    1. Blencowe H., Cousens S., Chou D., Oestergaard M., Say L., Moller A.-B., Kinney M., Lawn J. Born Too Soon: The global epidemiology of 15 million preterm births. Reprod. Health. 2013;10:S2. - PMC - PubMed
    1. Liu L., Johnson H.L., Cousens S., Perin J., Scott S., Lawn J.E., Rudan I., Campbell H., Cibulskis R., Li M., et al. Global, regional, and national causes of child mortality: an updated systematic analysis for 2010 with time trends since 2000. Lancet. 2012;379:2151–2161. - PubMed
    1. Norwitz E.R., Caughey A.B. Progesterone Supplementation and the Prevention of Preterm Birth. Rev. Obstet. Gynecol. 2011;4:60–72. - PMC - PubMed
    1. Lynch A.M., Hart J.E., Agwu O.C., Fisher B.M., West N.A., Gibbs R.S. Association of extremes of prepregnancy BMI with the clinical presentations of preterm birth. Am. J. Obstet. Gynecol. 2014;210:428.e1–428.e9. - PubMed

Publication types