. 2024 Jan 8;42(1):35-51.e8.
doi: 10.1016/j.ccell.2023.11.011. Epub 2023 Dec 21.

Immune determinants of CAR-T cell expansion in solid tumor patients receiving GD2 CAR-T cell therapy

Affiliations

Immune determinants of CAR-T cell expansion in solid tumor patients receiving GD2 CAR-T cell therapy

Sabina Kaczanowska et al. Cancer Cell. .

Abstract

Chimeric antigen receptor T cells (CAR-Ts) have remarkable efficacy in liquid tumors, but limited responses in solid tumors. We conducted a Phase I trial (NCT02107963) of GD2 CAR-Ts (GD2-CAR.OX40.28.z.iC9), demonstrating feasibility and safety of administration in children and young adults with osteosarcoma and neuroblastoma. Since CAR-T efficacy requires adequate CAR-T expansion, patients were grouped into good or poor expanders across dose levels. Patient samples were evaluated by multi-dimensional proteomic, transcriptomic, and epigenetic analyses. T cell assessments identified naive T cells in pre-treatment apheresis associated with good expansion, and exhausted T cells in CAR-T products with poor expansion. Myeloid cell assessment identified CXCR3+ monocytes in pre-treatment apheresis associated with good expansion. Longitudinal analysis of post-treatment samples identified increased CXCR3- classical monocytes in all groups as CAR-T numbers waned. Together, our data uncover mediators of CAR-T biology and correlates of expansion that could be utilized to advance immunotherapies for solid tumor patients.

Keywords: CAR-T cells; cancer; chimeric antigen receptor; correlative studies; immune suppression; immunotherapy; monocytes; myeloid cells; osteosarcoma; pediatric oncology; solid tumor.


Conflict of interest statement

Declaration of interests C.J.W. receives research funding from Pharmacyclics and hold equity in BioNTech, Inc. F.M. is a cofounder of and has equity in Harbinger Health, has equity in Zephyr AI, and serves as a consultant for Harbinger Health, Zephyr AI, and Red Cell Partners and Exscientia. F.M. declares that none of these relationships are directly or indirectly related to the content of this manuscript. E.S. consults for and holds equity in Lyell Immunopharma and consults for Lepton Pharmaceuticals and Galaria. M.S.M. is currently employed at Normunity and holds stock in AstraZeneca; her contributions to this work were made prior to these industry positions which are not relevant to the content of this manuscript. C.L.M. is an inventor on numerous patents and patents pending related to CAR-T cell therapies. C.L.M. holds equity in and receives research funding from Lyell Immunopharma and holds equity in and consults for CARGO Therapeutics and Link Cell Therapies. C.L.M. consults for Immatics, Mammoth, Ensoma, and Red Tree Venture Capital.

Figures

Figure 1.
Figure 1.. GD2 CAR-T administration results in varying levels of CAR-T expansion
(A) Schematic of GD2 CAR-T construct. (B) Timeline of treatment and sample collection for patients receiving GD2 CAR-T. (C) Swimmer’s plot representing patient response from time of GD2 CAR-T infusion. (D) Levels of CAR-T detected in the peripheral blood of patients as measured by qPCR of the GD2 CAR-T construct. (E) Stratification of patients into good and poor CAR-T expanders based on peak (maximum) level of GD2 CAR-T detected by qPCR. Boxplot represents all patients (dots) with median (line) and range (whiskers). (F) Fold change of cytokines in the plasma of patients on day 10 ± 4 (range day 7–14) following CAR-T administration over day 0 prior to CAR-T administration. Boxplot represents all patients (dots) with median (line) and range (whiskers). Statistical analysis conducted by Mann-Whitney test (n = 13). (G) Schematic of patient samples pre-treatment apheresis, CAR-T product, and post-treatment (day 1–60 after CAR-T infusion) multi-dimensional analyses, including proteomic (mass cytometry or CyTOF), transcriptomic (RNA-seq), and epigenetic (ATAC-seq) assays. Also see Figures S1, S2, and Tables S1–S3.
Figure 2.
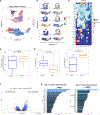
Figure 2.. CAR-T product samples display features of T cell exhaustion
(A) UMAP plot of T cell populations in GD2 CAR-T product using the T cell Phenotype CyTOF Panel (n = 12 patients). (B) Feature plots showing the distribution of expression of select CyTOF markers among the T cell populations. (C) Heatmap of hierarchical clustering of median marker expression in GD2 CAR-T product by CyTOF represented per patient. (D) Proportion of total cells represented in T cell Phenotype Panel clusters 3 and 6. Boxplot represents all patients (dots) with median (line) and range (whiskers). Statistics calculated by Mann-Whitney test (n = 12 patients). (E) The Activation Score based on Panther dataset. The Exhaustion Score was based on dataset of a previously described CAR-T model of exhaustion. Boxplot represents all patients (dots) with median (line) and range (whiskers). Statistical analysis conducted by Mann-Whitney test (n = 8 patients). (F) Volcano plot of CAR-T products demonstrates 60 chromatin features higher in accessibility in good or poor expanders based on FDR-adjusted p value≤0.05 and log2FC > 2 (n = 11 patients). (G) Open transcription factor motifs identified by combination of log(qvalue) and odds ratio (n = 11 patients). Also see Figures S3, S4, and Table S2.
Figure 3.
Figure 3.. Apheresis memory T cell signatures correlate with CAR-T expansion in patients
(A) UMAP clusters of immune cell populations in apheresis from the T cell Phenotype CyTOF Panel (n = 10 patients). (B) Median marker gene expression in populations in apheresis from the T cell Phenotype CyTOF Panel (n = 10 patients). (C) Violin plots of marker expression levels in each cell cluster from the T cell Phenotype CyTOF Panel (n = 10 patients). (D) Difference in proportion of cells in cluster 1 and cluster 4 in good versus poor expanders. Boxplot represents all patients (dots) with median (line) and range (whiskers). Statistical calculations by generalized linear mixed model. p values calculated as FDR-adjusted p values (n = 10 patients). (E) CyTOF manual gating characterization of memory CD8 and CD4 T cell populations based on CD45RA and CCR7 (n = 10 patients). (F) Selected C7 pathways significantly enriched in the transcriptome of good versus poor expanders (n = 10 patients). Statistical analysis calculated by Wilcoxon rank-sum test. (G) Principal component analysis (PCA) plot of patient samples analyzed by ATAC-seq colored by expansion (blue = good; orange = poor) (n = 11 patients). (H) Volcano plot of CAR-T products demonstrate 60 chromatin features up higher in accessibility in good or poor based on FDR-adjusted p value ≤ 0.05 and log2FC > 2 (n = 11 patients). (I) Open transcription factor motifs identified by combination of log(qvalue) and odds ratio (n = 11 patients). Also see Figures S3 and S4.
Figure 4.
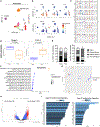
Figure 4.. Apheresis myeloid cells and myeloid cell activation programs are associated with poor CAR-T expansion
(A) UMAP clusters and boxplots of immune cell populations in apheresis from the Myeloid CyTOF Panel. Boxplot represents all patients (dots) with median (line) and range (whiskers). Statistical calculations by generalized linear mixed model. p values calculated as FDR-adjusted p values (n = 8). (B) Stacked bar plots of CIBERSORT data from RNA-seq analysis delimitating predicted immune cell composition in apheresis (n = 10 patients). (C) Enriched gene signatures stratified by CAR-T expansion. Boxplot represents all patients (dots) with median (line) and range (whiskers). Statistical calculations by FDR-adjusted p value (n = 10 patients). (D) Flow cytometry analysis of Myeloid-Derived Suppressor Cell (MDSC) phenotype in patients’ pre-treatment apheresis samples (n = 9). Statistical analysis calculated by Mann-Whitney test. (E) Selected C7 myeloid pathways significantly enriched in poor expanders compared to good expanders (n = 10 patients). Statistical analysis calculated by Wilcoxon rank-sum test.
Figure 5.
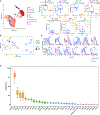
Figure 5.. Apheresis CXCR3 expression on monocytes is a marker of good CAR-T expansion
(A) UMAP clusters and boxplots (median and range) of myeloid cell subpopulations in apheresis from the Myeloid CyTOF Panel. Boxplot represents all patients (dots) with median (line) and range (whiskers). Statistical calculations by generalized linear mixed model. p values calculated as FDR-adjusted p values (n = 7 patients). (B) MDS plots of myeloid cell subpopulations in apheresis labeled by patient and colored by expansion (blue = good expansion; orange = poor expansion) (n = 7 patients). (C) Density plots showing expression of select markers (blue = good expansion; orange = poor expansion) (n = 7 patients). (D) Boxplot of importance scores from 30 iterations of random forest analysis depicting the strength of association of markers with CAR-T expansion and representative CyTOF expression plots. Markers are sorted by average importance scores. Boxplot represents all iterations (dots) with median (line) and range (whiskers) (n = 7 patients). Also see Figure S5.
Figure 6.
Figure 6.. Myeloid populations shift in response to CAR-T treatment
(A) Absolute monocyte count in peripheral blood 14 ± 3 days post CAR-T infusion. Boxplot represents all patients (dots) with median (line) and range (whiskers). Statistical analysis by Mann-Whitney test (n = 13). (B) Protein levels of GM-CSF and IL-12p70 in the plasma of patients 7–14 days and 25–27 days following CAR-T administration, respectively. Boxplot represents all patients (dots) with median (line) and range (whiskers). Statistical analysis by Mann-Whitney test (n = 13). (C) Stacked bar plots of patient samples by cluster from the Myeloid CyTOF Panel (n = 7 patients). (D) Boxplots of immune cell populations in pre- and post-treatment samples from the Myeloid CyTOF Panel. Boxplot represents all patients (dots) with median (line) and range (whiskers). Statistical calculations by generalized linear mixed model. p values calculated as FDR-adjusted p values (n = 7 patients). (E) Boxplot of CXCR3 expression on myeloid cells in pre- and post-treatment samples from the Myeloid CyTOF Panel. Boxplot represents all patients (dots) with median (line) and range (whiskers). Statistical calculations by linear mixed model. p values calculated as FDR-adjusted p values (n = 7 patients). (F) CXCR3 expression on myeloid cells in patients hospitalized versus not hospitalized with COVID-19. Boxplot represents all patients (dots) with median (line) andrange (whiskers). Statistical calculations by linear mixed model. p value calculated as FDR-adjusted p value (p = 0.117; n = 27 patients). (G) Overall survival of patients in TARGET-OS dataset stratified by expression level of CXCR3. Statistical analysis on group survival differences was performedutilizing the log rank test. Also see Supplemental Figure S5 and S6.

Comment in

References

    1. Louis DN, Perry A, Reifenberger G, von Deimling A, Figarella-Branger D, Cavenee WK, Ohgaki H, Wiestler OD, Kleihues P, and Ellison DW (2016). The 2016 World Health Organization Classification of Tumors of the Central Nervous System: a summary. Acta Neuropathol. 131, 803–820. - PubMed
    1. Perkins SM, Shinohara ET, DeWees T, and Frangoul H. (2014). Outcome for children with metastatic solid tumors over the last four decades. PLoS One 9, e100396. - PMC - PubMed
    1. Ceschel S, Casotto V, Valsecchi MG, Tamaro P, Jankovic M, Hanau G, Fossati F, Pillon M, Rondelli R, Sandri A, et al. (2006). Survival after relapse in children with solid tumors: a follow-up study from the Italian off-therapy registry. Pediatr. Blood Cancer 47, 560–566. - PubMed
    1. Meyers PA, Schwartz CL, Krailo MD, Healey JH, Bernstein ML, Betcher D, Ferguson WS, Gebhardt MC, Goorin AM, Harris M, et al. (2008). Osteosarcoma: the addition of muramyl tripeptide to chemotherapy improves overall survival–a report from the Children’s Oncology Group. J. Clin. Oncol. 26, 633–638. - PubMed
    1. Cooney T, Lane A, Bartels U, Bouffet E, Goldman S, Leary SES, Foreman NK, Packer RJ, Broniscer A, Minturn JE, et al. (2017). Contemporary survival endpoints: an International Diffuse Intrinsic Pontine Glioma Registry study. Neuro Oncol. 19, 1279–1280. - PMC - PubMed

Publication types

Substances

Associated data