. 2024 Mar;29(3):686-703.
doi: 10.1038/s41380-023-02361-z. Epub 2023 Dec 22.

Interplay between hippocampal TACR3 and systemic testosterone in regulating anxiety-associated synaptic plasticity

Affiliations

Interplay between hippocampal TACR3 and systemic testosterone in regulating anxiety-associated synaptic plasticity

Magdalena Natalia Wojtas et al. Mol Psychiatry. 2024 Mar.

Abstract

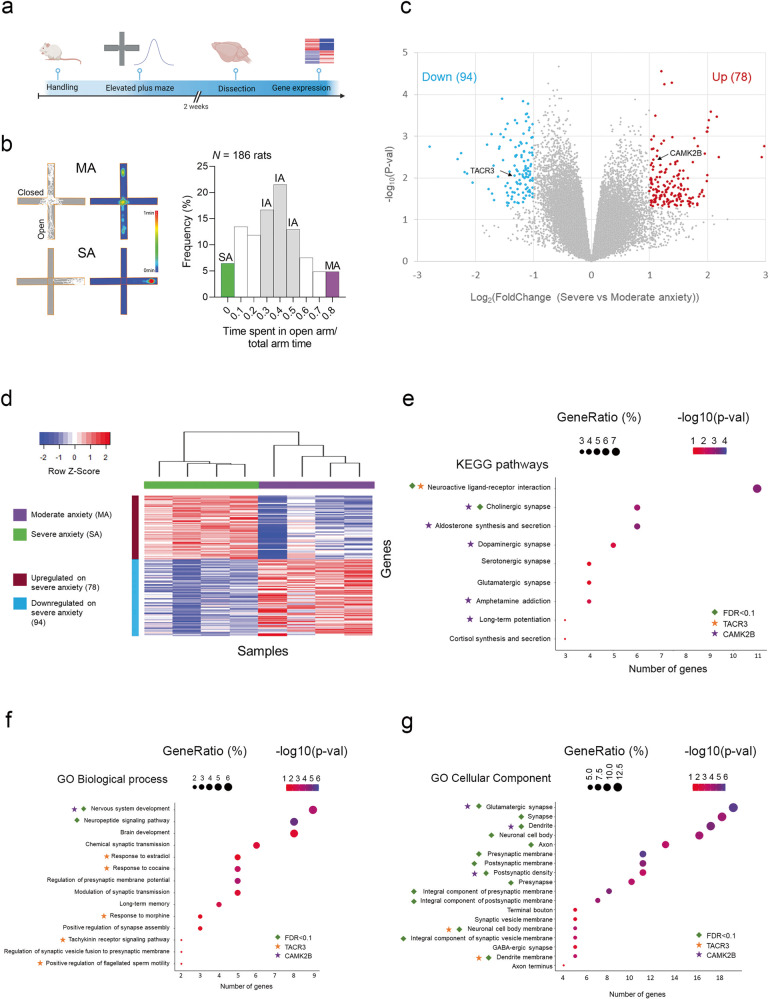
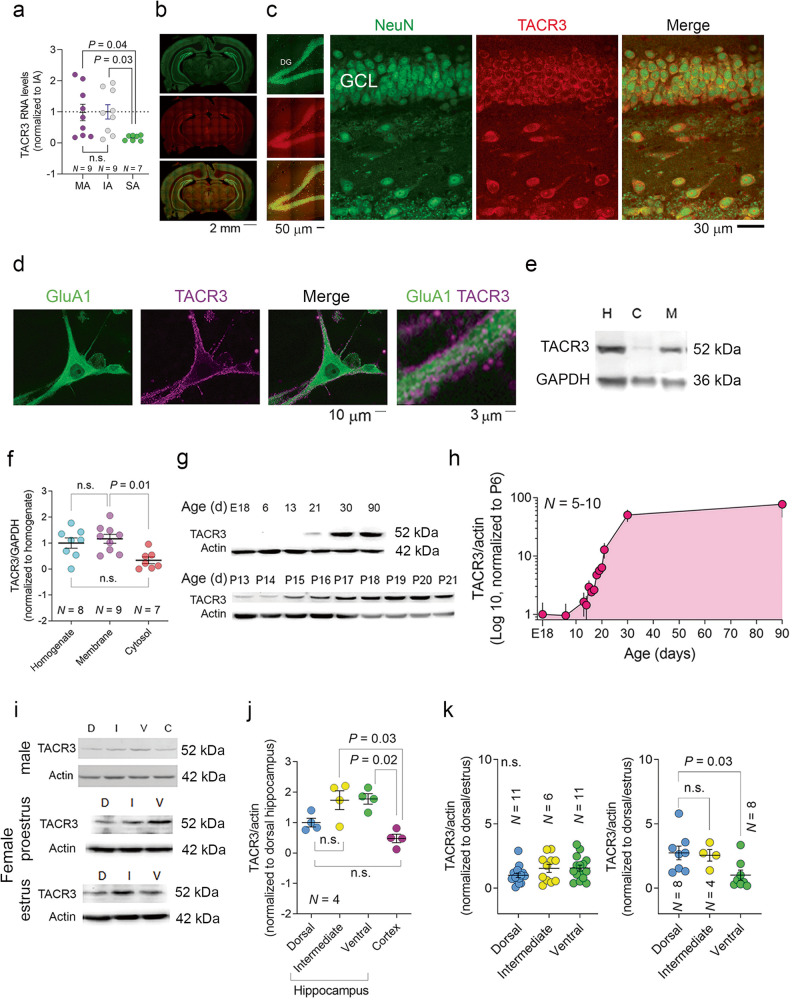
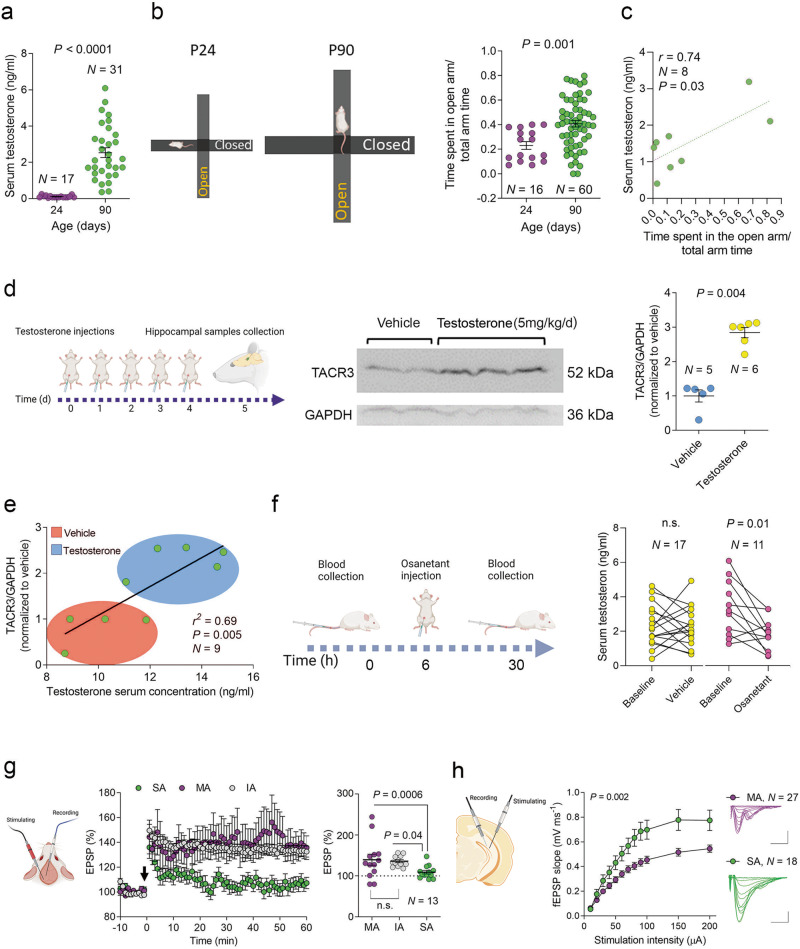
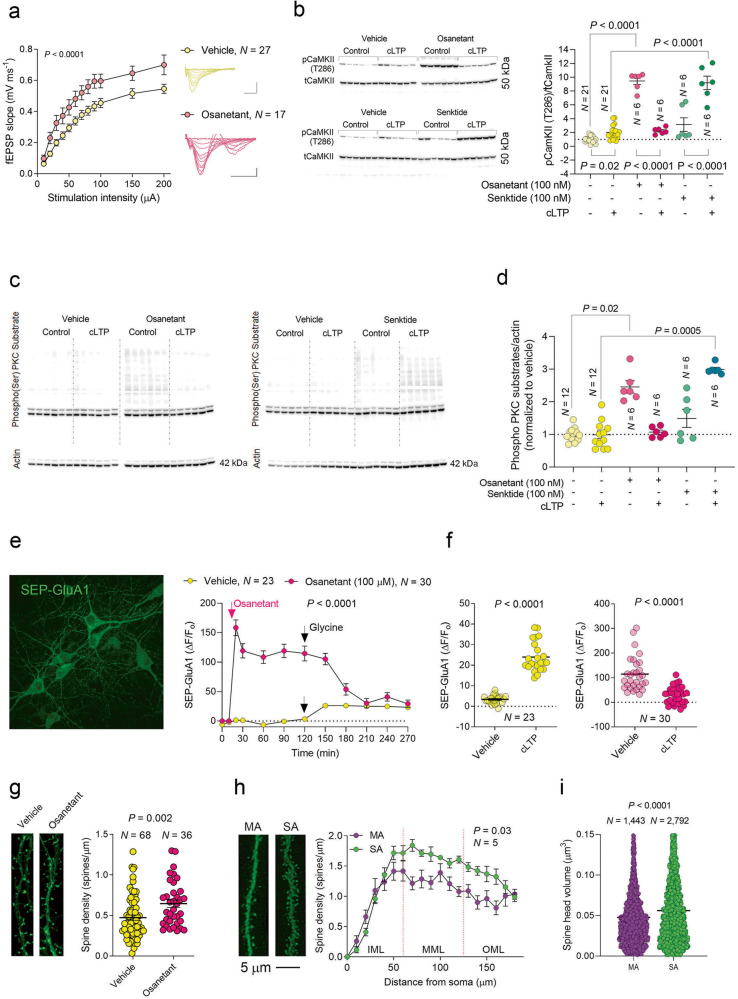
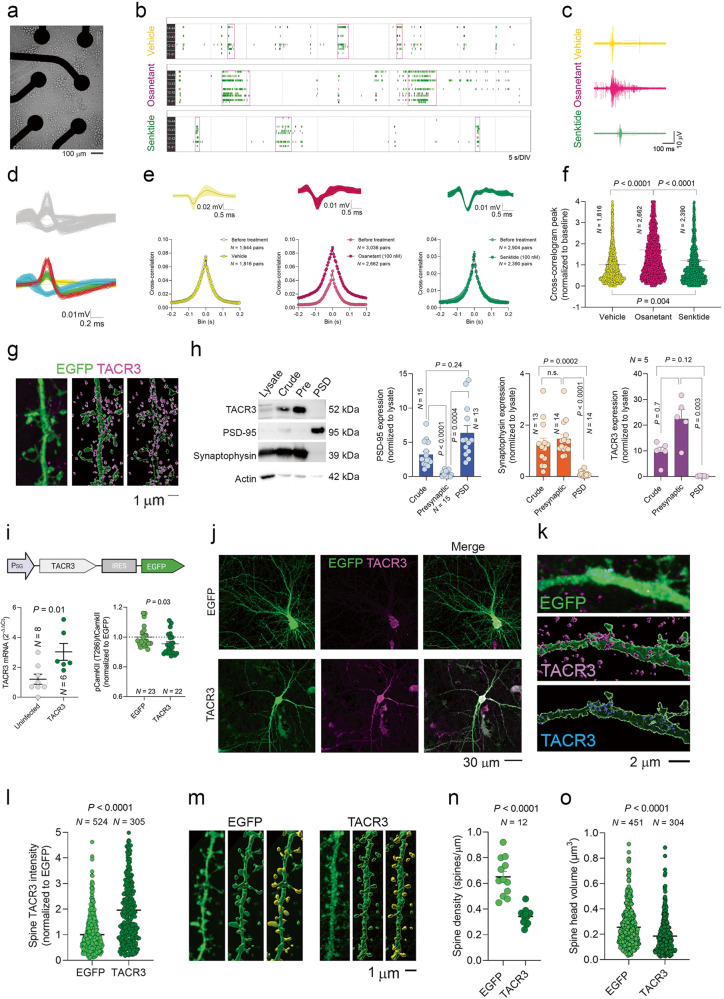
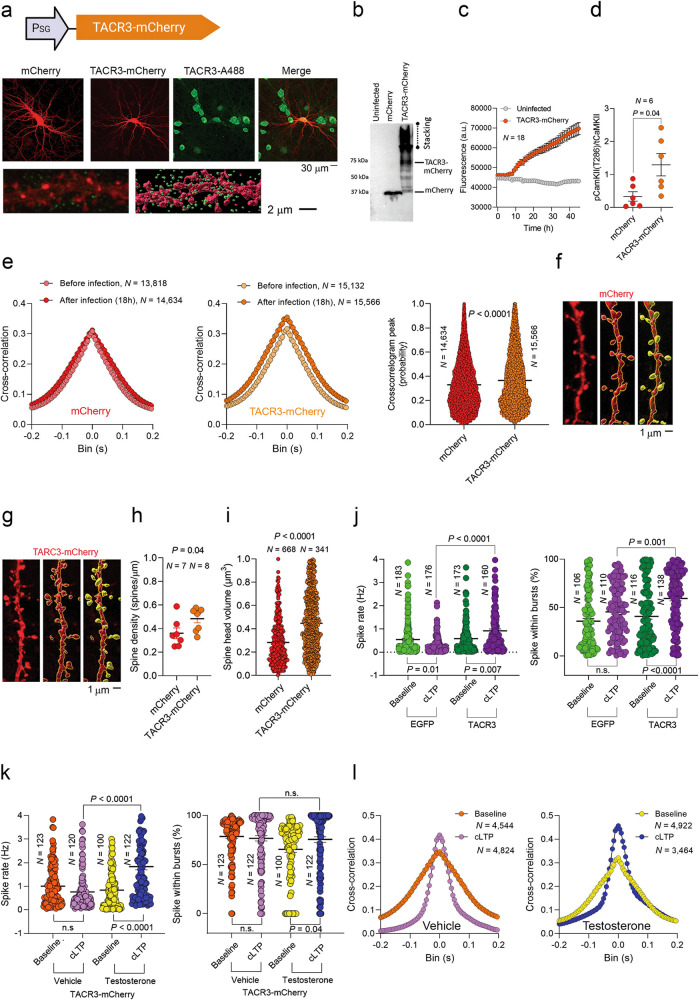
Tachykinin receptor 3 (TACR3) is a member of the tachykinin receptor family and falls within the rhodopsin subfamily. As a G protein-coupled receptor, it responds to neurokinin B (NKB), its high-affinity ligand. Dysfunctional TACR3 has been associated with pubertal failure and anxiety, yet the mechanisms underlying this remain unclear. Hence, we have investigated the relationship between TACR3 expression, anxiety, sex hormones, and synaptic plasticity in a rat model, which indicated that severe anxiety is linked to dampened TACR3 expression in the ventral hippocampus. TACR3 expression in female rats fluctuates during the estrous cycle, reflecting sensitivity to sex hormones. Indeed, in males, sexual development is associated with a substantial increase in hippocampal TACR3 expression, coinciding with elevated serum testosterone and a significant reduction in anxiety. TACR3 is predominantly expressed in the cell membrane, including the presynaptic compartment, and its modulation significantly influences synaptic activity. Inhibition of TACR3 activity provokes hyperactivation of CaMKII and enhanced AMPA receptor phosphorylation, associated with an increase in spine density. Using a multielectrode array, stronger cross-correlation of firing was evident among neurons following TACR3 inhibition, indicating enhanced connectivity. Deficient TACR3 activity in rats led to lower serum testosterone levels, as well as increased spine density and impaired long-term potentiation (LTP) in the dentate gyrus. Remarkably, aberrant expression of functional TACR3 in spines results in spine shrinkage and pruning, while expression of defective TACR3 increases spine density, size, and the magnitude of cross-correlation. The firing pattern in response to LTP induction was inadequate in neurons expressing defective TACR3, which could be rectified by treatment with testosterone. In conclusion, our study provides valuable insights into the intricate interplay between TACR3, sex hormones, anxiety, and synaptic plasticity. These findings highlight potential targets for therapeutic interventions to alleviate anxiety in individuals with TACR3 dysfunction and the implications of TACR3 in anxiety-related neural changes provide an avenue for future research in the field.


Conflict of interest statement

The authors declare no competing interests.

Figures

Fig. 1
Fig. 1. Analysis of hippocampal gene expression in rats with diverse anxiety-like behaviors.
a Experimental design. Rats were categorized based on their performance in the elevated plus maze (EPM), and two weeks later, their hippocampus was extracted for gene expression analysis. b Classification of rats in the EPM. Left: Representative traces from the EPM showing the path (left) and color-coded time spent in each location of the maze (right) by rats categorized with moderate (MA) or severe anxiety (SA). Right: Frequency distribution of the EPM scores for all rats: the rats with extreme scores, indicated in color, were selected for gene expression analysis. c Volcano plot of the differential gene expression in MA and SA rats. Upregulated genes are shown in red, downregulated genes in blue, and non-significantly changed genes in gray, based on their statistical significance (-log10 p-value) and fold change (log2 fold change) values. d Hierarchical clustering was performed on eight samples (four with SA and four with MA) using Euclidean distances calculated from the expression of 172 differentially expressed genes (DEGs). The clustering analysis resulted in the formation of distinct clusters, and the colors in the heat map represent row-scaled expression values, with blue indicating weak expression and red indicating strong expression. Dot plots illustrating the enriched (e) KEGG pathways, (f) GO biological processes, and (g) GO cellular components associated with the DEGs. Each dot’s position on the x-axis represents the number of genes out of the 172 DEGs enriched for the corresponding term displayed on the y-axis. The dot’s size and color indicate the GeneRatio (proportion of DEGs within the pathway/process/component out of the 143 DEGs found in the DAVID database) and the level of significance, respectively. The terms are ordered based on the number of DEGs on the x-axis. Terms with an FDR (False Discovery Rate) < 0.1 or containing TACR3 or CAMK2B genes are marked [26] (For a comprehensive list of genes, see 10.5281/zenodo.8305270).
Fig. 2
Fig. 2. TACR3 expression depends on sex hormones.
a TACR3 expression in the ventral hippocampus analyzed by qPCR. Total RNA was isolated from the ventral hippocampus of male SA, IA, and MA rats and analyzed by qPCR using TACR3-specific primers. The relative TACR3 mRNA expression was calculated using the 2^-ΔΔCt method and presented as dots for individual values and as the mean ± SEM. Statistical significance was determined using the Kruskal-Wallis test, followed by Dunn’s multiple comparisons tests. N represents the number of rats. b Representative images of TACR3 immunohistochemistry in coronal brain sections of adult male rats. TACR3 expression is shown in red (Alexa 594), and neurons (green, Alexa 488) were identified with NeuN. c Left: Confocal images of the dentate gyrus. Right: High magnification (60x) images demonstrating TACR3 expression in red (Alexa 594) and labeling for a neuronal marker (NeuN) in green (Alexa 488). d Confocal image of TACR3 labeling in primary hippocampal neurons. Neurons were stained with a TACR3-specific primary antibody that was detected with an Alexa594 fluorescently labeled secondary antibody. TACR3 staining (purple) was observed in the cell body and around the dendrites of hippocampal neurons, with a punctate distribution. Co-staining with GluA1 (green, Alexa488) does not indicate co-localization. e Representative Western blot of TACR3 expression of hippocampal samples fractionated into cytosolic and membrane fractions. f Quantification of TACR3 protein expression relative to GAPDH expression in the homogenate (H), cytosol (C), and membrane (M) fractions. Each dot represents the values for a single rat and the data are also presented as the mean ± SEM. Statistical significance was determined using a Kruskal-Wallis test followed by Dunn’s multiple comparisons tests, and N represents the number of rats in each group. g Western blot of TACR3 protein expression in the hippocampus during development. Hippocampal tissue lysates were collected from male rats at different stages of development. h The TACR3 protein expression of normalized to β-actin across different developmental stages. The results show a gradual increase in TACR3 expression during development, representing the data as the mean ± SEM. N is the number of rats per age (N = 5 for E18, P6, P30, P90; N = 10 for the rest of the time points). i Representative Western blots of TACR3 expression in cortex and hippocampus lysates from adult male rats, and female rats at the estrous cycle’s proestrus and estrus stages. j Analysis of TACR3 expression in the hippocampus and cortex. TACR3 protein expression was analyzed in the dorsal hippocampus, ventral hippocampus, the intermediate area between them, and in the cortex of adult male rats. Each dot represents the value of a single rat, and the data are also presented as the mean ± SEM. Statistical significance was determined using the Kruskal-Wallis test, followed by Dunn’s multiple comparisons tests, and N represents the number of rats in each group. k The figure shows TACR3 expression in the hippocampus of female rats at different stages of the estrous cycle, with proestrus on the left and estrus on the right. Each dot represents the value of a single rat, and the data are also presented as the mean ± SEM. Statistical significance was determined using the Kruskal-Wallis test, followed by Dunn’s multiple comparisons tests, and N represents the number of rats in each group.
Fig. 3
Fig. 3. The interaction between TACR3 expression, testosterone levels, and rat anxiety-like behavior.
a Using ELISA, Serum testosterone levels were measured in male rats on postnatal days 24 (P24) and 90 (P90). The graph displays the values for each rat and the mean ± SEM testosterone levels (ng/ml) in each age group. The testosterone levels increased significantly from P24 to P90, and the statistical significance was determined using the Mann-Whitney test. N represents the number of rats in each group. b Left: A schematic representation of the elevated plus-mazes used for behavioral testing of P24 (left) and P90 (right) male rats. The maze size was proportionally similar to the size of the rats, ensuring appropriate scaling for the experimental conditions. Right: The graph illustrates the scores from the EPM test in P24 and P90 rats. P90 rats exhibited a significantly higher score, spending more time in the open arms of the maze compared to P24 rats. This observation suggests P90 rats display less intense anxiety-like behavior as they have a greater propensity to explore the open areas of the maze. Each dot represents the score of a single rat in the test, and the data are also presented as the mean ± SEM. The statistical significance was determined using the Mann-Whitney test, and N represents the number of rats in each group. c Correlation between the serum testosterone levels and EPM score for individual male rats (3 months old). Statistical significance was determined using Pearson’s correlation, and N represents the number of rats. d Left: Scheme of the experimental design. Male rats were randomly assigned to a testosterone or control group (vehicle), with the rats in the testosterone group receiving daily subcutaneous injections of testosterone propionate (5 mg/kg) over five consecutive days. On the sixth day, the rats were sacrificed, and the hippocampus was collected for analysis. Middle: Western blot of TACR3 expression in the hippocampus. Right. A graph showing the quantification of TACR3 protein expression demonstrating a significant upregulation of TACR3 expression in the hippocampus of testosterone-treated rats relative to the control rats. Each dot represents the value of one rat and the statistical significance was determined using a Mann-Whitney test. N represents the number of rats in each group. e The correlation between serum testosterone levels and hippocampal TACR3 expression for individual male rats (3 months old) demonstrating a positive correlation between serum testosterone and hippocampal TACR3 expression. Statistical significance was determined using Pearson’s correlation and N represents the number of rats. f Left: Scheme of the experimental design used to examine the effect of osanetant on the serum testosterone levels in rats. Rats were randomly divided into two groups: a treatment group receiving a single intraperitoneal dose of osanetant (5 mg/kg) and a control group receiving the vehicle alone. Blood samples were collected from each rat via tail puncture 6 h before and 24 h after the treatment, measuring the testosterone levels in the serum. The graph on the right displays the individual values of the rats before and after osanetant or vehicle treatment. Statistical significance was determined using a Paired t test, evaluating the changes within each group, and N represents the number of rats. g Left: Representation of a rat head indicating the location of the stimulating and recording electrodes. Middle: In vivo LTP in the dentate gyrus of rats categorized as MA, IA, and SA, highlighting the LTP impairment in SA rats. Right: Quantification of the EPSP changes in the last 10 min of the recording. Each dot represents the value of a single rat and N represents the number of rats. Statistical significance was determined using a Kruskal-Wallis test followed by Dunn’s multiple comparisons tests. h Left: A diagram illustrating a hippocampal slice, delineating the positioning of both the stimulating and recording electrodes during field potential recording within the dentate gyrus. Middle: Input-output curves representing field excitatory postsynaptic potentials (fEPSPs) induced by stimulation of perforant path axons in slices of MA and SA rats. Right: Overlay of sample fEPSPs at increasing stimulation intensities from 10 to 200 μA. P-values were calculated using a two-way ANOVA, and N represents the number of slices. The scale bars applicable to all panels are set at 0.5 mV and 20 ms, and the data are presented as the mean ± standard error of the mean (SEM), as shown by the error bars.
Fig. 4
Fig. 4. Impact of TACR3 deficiency or inhibition on synaptic connectivity and LTP.
a Left: Input-output curves representing field excitatory postsynaptic potentials (fEPSPs) induced by stimulation of the perforant path axons in slices treated with osanetant or vehicle. Right: Overlay of sample fEPSPs at increasing stimulation intensities from 10 to 200 μA. The P-values were determined using a two-way ANOVA and N represents the number of slices. The scale bars applicable to all panels are set at 0.5 mV and 20 ms, and the data are presented as the mean ± standard error of the mean (SEM), as shown by the error bars. b Left: Western blots probed for phospho CaMKII (T286) following treatment with osanetant and senktide. Right: Phospho CaMKII/total CaMKII levels after different treatments. Each dot in the graph represents the value of a single culture and the statistical significance was determined with a one-way ANOVA followed by Tukey’s multiple comparisons tests. The difference between senktide and the vehicle is not statistically meaningful, with N representing the number of cultures in each group. c Western blot analyzing the phospho PKC substrates in cultures treated with osanetant or senktide before cLTP induction. d Quantification of the phospho PKC substrates. Each dot represents a single culture, and the statistical significance was determined by one way ANOVA followed by Tukey’s multiple comparisons tests. N indicates the number of cultures in each group. e Left: Primary hippocampal neurons expressing SEP-GluA1, a fluorescent marker for that AMPAR subunit at the neuronal surface. Right: Quantification of changes in surface SEP-GluA1 following osanetant treatment and cLTP induction. N represents the number of cultures. f Changes in surface AMPAR expression in neurons pretreated with the vehicle (left, yellow) or osanetant (right, pink), following cLTP induction. Each dot in the graph represents the value of a single culture and N represents the number of cultures. Statistical significance was determined using a paired t test. g Left: High-magnification (63x) maximum projection confocal image of dendrites and spines. Right: Spine density after treatment with vehicle or osanetant. N represents the number of neurons, and the statistical significance was determined using a Mann-Whitney test. h Left: Dendrites of granular neurons injected with Lucifer Yellow. Right: Sholl analysis demonstrating the relationship between spine density and the distance from the soma. N represents the number of rats in each group and the statistical significance was determined by two-way ANOVA. i Spine head volume in granular neurons of MA and SA rats. N represents the number of spines, and the statistical significance was determined using a Mann-Whitney test.
Fig. 5
Fig. 5. TACR3 function determines the cross-correlation among pairs of neurons.
a Representative image of neurons cultured on a multielectrode array (MEA) acquired at 10x magnification on an inverted microscope. Each MEA consists of 16 planar electrodes arranged in a 4 × 4 grid. Neurons were cultured for 14 DIV, allowing a complex network of neurites and synapses to develop on the MEA surface. The MEA serves as a platform for non-invasive, long-term monitoring of neuronal activity. b Raster plots illustrating the firing activity of neurons on MEAs (DIV 14) after osanetant or senktide treatment: black lines represent individual electrode activity; green lines indicate the bursting activity of specific electrodes; and purple rectangles depict network bursts. Electrode numbers are displayed on the left side of the plots. c Examples of raw voltage traces obtained from single electrodes in MEA recordings using AxIS acquisition software. Gray bars indicate spike detection thresholds. d The upper panel displays the raw voltage traces recorded from a single electrode channel, whereas the lower panel demonstrates the same data after spike sorting using a principal component analysis (PCA). Before spike sorting, the raw voltage traces exhibit substantial noise and contain overlapping spikes from multiple neurons. Following spike sorting, individual spikes can be accurately differentiated and attributed to their respective neurons based on their waveforms. e The impact of osanetant and senktide treatment on the average cross-correlograms obtained from spike recordings that underwent spike sorting. Cross-correlograms were computed to assess the correlation between pairs of neurons based on their spike times. The upper panel displays an example of a single spike sorted throughout the recording duration. The lower panel presents the average cross-correlograms before treatment, representing the neuronal correlation in the absence of drug treatment and after treatment with osanetant or senktide, reflecting changes in neuronal correlation following drug administration. N represents the number of pairs of neurons. f The influence of different drugs on the peaks of cross-correlograms. Each data point on the graph represents the peak value of an individual cross-correlogram between two neurons. Statistical significance was determined using one-way ANOVA followed by Tukey’s multiple comparisons tests. g Left: Confocal projection image (63x) depicting a dendrite from a primary hippocampal neuron expressing EGFP (green) and immunostained with a TACR3 antibody (purple). Middle: Three-dimensional reconstruction of the dendrite and TACR3-positive punctae using the Surface module of Imaris software. Right: Dendritic contours illustrating the distribution of TACR3 labeled punctae around the dendrites rather than within them. h Left: Western blot analysis showing synaptic markers (PSD-95 and synaptophysin) in a synaptosomal preparation, along with TACR3 detected in the presynaptic compartment. Right: Quantification of the synaptic proteins, with each data point representing the values (normalized to crude synaptosome values) from the hippocampus of individual rats. Statistical significance was determined using one-way ANOVA followed by Tukey’s multiple comparisons tests. i Top: The construct for TACR3 overexpression containing TACR3 followed by an IRES and EGFP. Bottom, left: Quantifying TACR3 expression by qPCR in uninfected cultures compared to those infected with the TACR3 virus confirms successful overexpression. Bottom, right: normalized levels of pCaMKII/tCaMKII as determined by a microplate reader. Each data point represents the value of a single culture, and the statistical significance was determined using the Mann-Whitney test. N represents the number of cultures. j Representative examples of neurons expressing either EGFP alone or TACR3 along with EGFP, immunostained with a TACR3 antibody. k Top: Confocal projection image (63x) of a dendrite from a primary hippocampal neuron expressing TACR3 (TACR3-IRES-EGFP, green) and immunostained with a TACR3 antibody (purple). Middle: Three-dimensional reconstruction of the dendrite and TACR3-positive punctae using the Surface module of Imaris software, highlighting the presence of TACR3-positive puncta around the dendrite (purple). Bottom: Dendritic contours outlining the distribution of TACR3-positive punctae within the dendrites (blue). l Measurement of the TACR3 in dendritic spines of neurons expressing EGFP alone (EGFP) or neurons overexpressing both TACR3 and EGFP (TACR3). The statistical significance was determined using the Mann-Whitney test and N represents the number of spines analyzed. m Left: Dendrites from neurons expressing EGFP alone (EGFP) or neurons overexpressing both TACR3 and EGFP (TACR3). Middle: Three-dimensional structure of the same dendrites captured using the Surface module of Imaris software. Right: Dendritic spine heads were visualized using the Surface module of Imaris software, quantifying the spine density and spine head volume. n, o Quantification of spine density and spine head volume using Imaris software. Statistical significance was determined using the Mann-Whitney test and N represents the number of dendrites analyzed for spine density or the number of spines analyzed for spine head volume. Each data point represents the value obtained from a single dendrite or spine.
Fig. 6
Fig. 6. Testosterone treatment rescues the impaired response to cLTP induction observed in neurons with dysfunctional TACR3 expression.
a Top: Structure of the TACR3-mCherry overexpression construct. Middle: Representative confocal images of neurons expressing mCherry or TACR3-mCherry (red) immunostained with a TACR3 antibody (green). Bottom: High-magnification view of a dendrite from a TACR3-mCherry expressing neuron (left), revealing TACR3 puncta surrounding the dendrite (depicted as green circles) and the three-dimensional reconstruction of the dendrites, spines and TACR3 puncta obtained with the Imaris software (right). b Western blot analysis illustrating the migration of mCherry on the gel compared to the delayed migration of TACR3-mCherry and its retention in the stacking gel, indicative of the aggregation of this fusion protein. c Real-time monitoring of TACR3-mCherry fluorescence measured using a microplate reader over 48 h. N represents the number of cultures. d Phospho CaMKII/total CaMKII levels in neuorns infected with mCherry or with TACR3-mCherry. N is the number of culturs and the P value was determined with a Mann-Whitney test. e Left: The effect of mCherry and TACR3-mCherry on average cross-correlograms obtained from spike recordings subjected to spike sorting. The average cross-correlograms before infection and 18 h after infection highlight the changes in neuronal correlation following the expression of TACR3-mCherry. N represents the number of neuron pairs analyzed. Right: The impact of recombinant protein expression on the peaks of cross-correlograms. Each data point on the graph represents the peak value of an individual cross-correlogram between two neurons, and the statistical significance was assessed using a Mann-Whitney test. f, g Left: Dendrites from neurons expressing mCherry alone (mCherry) or neurons overexpressing the TACR3-mCherry fusion protein. Middle: Three-dimensional structure of the same dendrites captured using the Surface module of the Imaris software. Right: Dendritic spine heads were visualized using the Surface module of the Imaris software, allowing the spine density and spine head volume to be quantified. h, i Quantification of spine density and spine head volume using Imaris software. Statistical significance was determined with a Mann-Whitney test, with N representing the number of dendrites analyzed for spine density or the number of spines analyzed for spine head volume. Each data point represents the value obtained from a single dendrite or spine. j, k Spike rate and the proportion of the spikes within bursts in neurons expressing EGFP, TACR3 or TACR3-mCherry, before and after cLTP induction, and with or without testosterone pre-treatment. Each dot represents the value of a single neuron, and the statistical significance was determined using a Kruskal-Wallis test followed by Dunn’s multiple comparisons tests. N represents the number of neurons. l The impact of cLTP induction and testosterone pre-treatment on the cross-correlograms of neurons expressing TACR3-mCherry. Average cross-correlograms were analyzed before cLTP induction and 4 h after induction. The number of neuron pairs analyzed is represented by N. For the raster plots of this experiment and the cross-correlograms of neurons expressing mCherry, please refer to Supplementary Figs. 5b and 6a.

References

    1. Herbison AE. Control of puberty onset and fertility by gonadotropin-releasing hormone neurons. Nat Rev Endocrinol. 2016;12:452–66. - PubMed
    1. Nathan BM, Palmert MR. Regulation and disorders of pubertal timing. J Endocrinol Metab Clin. 2005;34:617–41. - PubMed
    1. Aydogan U, Aydogdu A, Akbulut H, Sonmez A, Yuksel S, Basaran Y, et al. Increased frequency of anxiety, depression, quality of life and sexual life in young hypogonadotropic hypogonadal males and impacts of testosterone replacement therapy on these conditions. Endocr J. 2012;59:1099–105. - PubMed
    1. Rey RA, Grinspon R, Gottlieb S, Pasqualini T, Knoblovits P, Aszpis S, et al. Male hypogonadism: an extended classification based on a developmental, endocrine physiology‐based approach. J Androl. 2013;1:3–16. - PubMed
    1. Dwyer AA, Quinton R. Anatomy and physiology of the hypothalamic-pituitary-gonadal (HPG) axis. Adv Pract Endocrinol Nurs. 2019;43:839–52.

Publication types