. 2024 Mar;29(3):809-819.
doi: 10.1038/s41380-023-02372-w. Epub 2023 Dec 22.

ABCA7 deficiency causes neuronal dysregulation by altering mitochondrial lipid metabolism

Affiliations

ABCA7 deficiency causes neuronal dysregulation by altering mitochondrial lipid metabolism

Keiji Kawatani et al. Mol Psychiatry. 2024 Mar.

Abstract

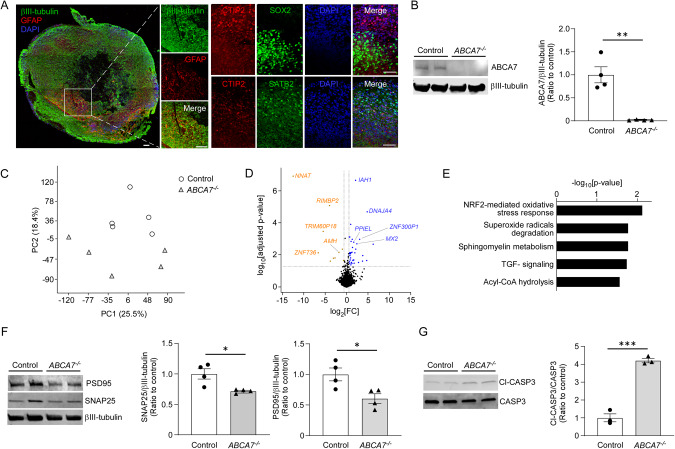
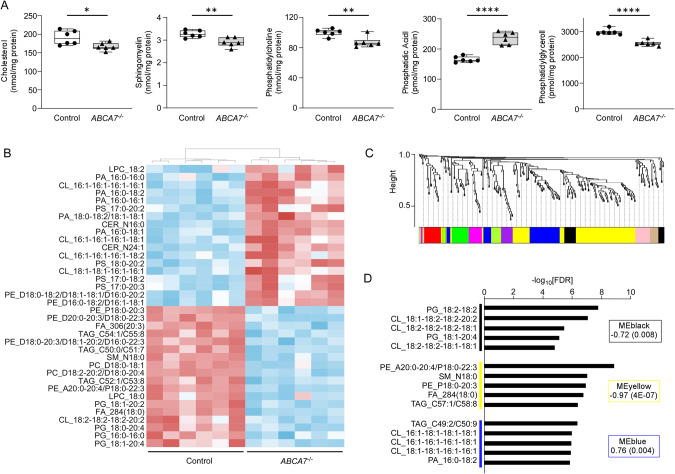
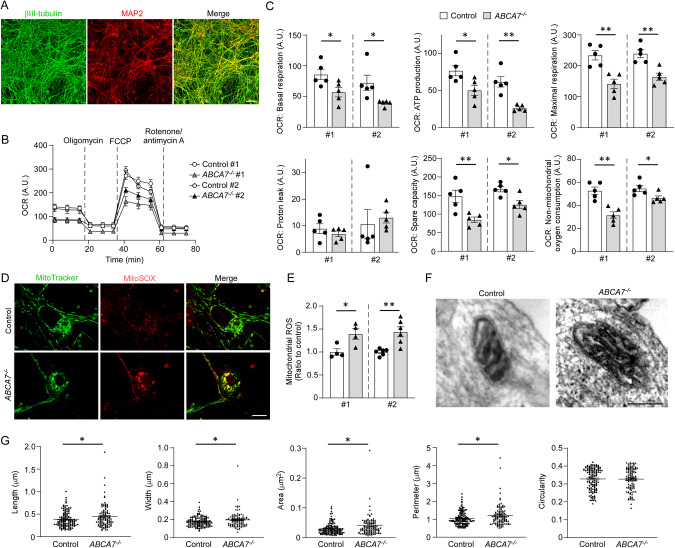
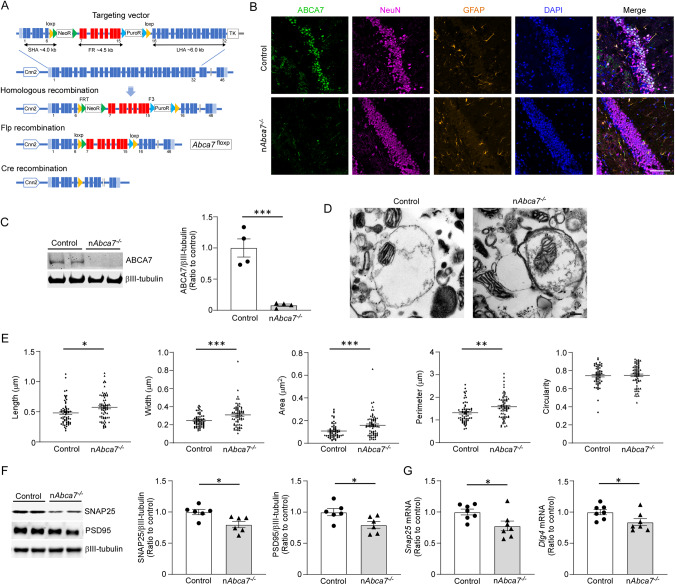
ABCA7 loss-of-function variants are associated with increased risk of Alzheimer's disease (AD). Using ABCA7 knockout human iPSC models generated with CRISPR/Cas9, we investigated the impacts of ABCA7 deficiency on neuronal metabolism and function. Lipidomics revealed that mitochondria-related phospholipids, such as phosphatidylglycerol and cardiolipin were reduced in the ABCA7-deficient iPSC-derived cortical organoids. Consistently, ABCA7 deficiency-induced alterations of mitochondrial morphology accompanied by reduced ATP synthase activity and exacerbated oxidative damage in the organoids. Furthermore, ABCA7-deficient iPSC-derived neurons showed compromised mitochondrial respiration and excess ROS generation, as well as enlarged mitochondrial morphology compared to the isogenic controls. ABCA7 deficiency also decreased spontaneous synaptic firing and network formation in iPSC-derived neurons, in which the effects were rescued by supplementation with phosphatidylglycerol or NAD+ precursor, nicotinamide mononucleotide. Importantly, effects of ABCA7 deficiency on mitochondria morphology and synapses were recapitulated in synaptosomes isolated from the brain of neuron-specific Abca7 knockout mice. Together, our results provide evidence that ABCA7 loss-of-function contributes to AD risk by modulating mitochondria lipid metabolism.


Conflict of interest statement

TK consults Ono Pharma, Inc. YAM is currently an employee of SciNeuro Pharmaceuticals. Other authors declare no competing interests.

Figures

Fig. 1
Fig. 1. Characterization and synaptic loss in ABCA7/ iPSC-derived cortical organoids.
Isogenic control and ABCA7/ iPSCs (#1) were differentiated into cortical organoids and analyzed at Day 60 of differentiation. A Representative images of the ventricular zone (VZ)-like structure (βIII-Tubulin, neuronal marker; SOX2, neural progenitor cell marker; GFAP, astrocyte maker; CTIP2, deep cortical layer marker; and SATB2 superficial cortical layer marker) in cerebral organoids. Nuclei were stained with DAPI. Scale bars: 100 µm. B ABCA7 levels in the iPSC organoids were analyzed by Western blotting and normalized by βIII-tubulin levels (n = 4 technical replicates/line). CE Bulk RNA-sequencing was performed in the iPSC-derived cortical organoids. PCA plot (C), volcano plot (D), and the top 5 pathways enriched by DEGs (E) are shown (n = 6 technical replicates/line). The step-up adjustment was based on the Benjamin-Hochberg procedure. F Levels of presynaptic protein (SNAP25) and postsynaptic protein (PSD95) in the iPSC organoids were analyzed by Western blotting and normalized by βIII-tubulin levels (n = 4 clones/line). G Levels of cleaved caspase 3 and full-length caspase 3 in the iPSC organoids were analyzed by Western blotting and their ratio was plotted (n = 3 technical replicates/line). Three cortical organoids cultured in an identical dish were lysed together and analyzed as one sample. Data represents mean ± SEM. *p < 0.05, **p < 0.01 by two-tailed student’s t-test.
Fig. 2
Fig. 2. Altered lipid profile in ABCA7/ iPSC-derived cortical organoids.
Lipidomics was performed in the cortical organoids derived from isogenic control and ABCA7/ iPSCs (#1). Three iPSC organoids cultured in an identical dish were lysed together and analyzed as one sample (n =  6 technical replicates/line). All lipid concentrations were normalized to total protein levels. A Major lipid species with significant differences are shown. Data represent mean ± SEM. *p < 0.05, **p < 0.01, ****p < 0.0001 by two-tailed student’s t-test. B Heat map of lipid subspecies altered by ABCA7 deficit is shown. C The correlation between lipid module eigengenes and ABCA7 deficit is shown. D The black, yellow, and blue modules showed a correlation with p < 0.05. The FDR of the top 5 hub lipids was visualized.
Fig. 3
Fig. 3. Impaired mitochondrial respiration and altered morphology in ABCA7/ iPSC-derived neurons.
A Immunocytochemical staining of iPSC-derived neurons 6 weeks after differentiation from NPCs for neuron markers with βIII-tubulin and MAP2. Nuclei were stained with DAPI. Scale bar: 100 µm. B, C Mitochondrial respiration in neurons derived from isogenic control and ABCA7/ iPSCs (#1 and #2) were measured by Mito Stress Test Kit through Seahorse XFe96 Extracellular Flux Analyzer 6 weeks after differentiation. The OCR measurements were normalized to cell density determined by nuclear DAPI staining in each well (n = 5 technical replicates/line). A.U., arbitrary unit. D, E The iPSC-derived neurons were stained for MitoSOX and MitoTracker. Mitochondrial ROS was assessed as relative MitoSOX/MitoTracker ratio (n = 4–6 technical replicates/line). Scale bars: 200 nm. F, G Representative electron microscope images of mitochondria in the iPSC-derived neurons are shown. The length, width, area, perimeter, and circularity of mitochondria in neurons derived from isogenic control and ABCA7/ iPSCs (#1) were measured with ImageJ. (Control: n = 134 mitochondria from 3 clones, ABCA7/: n = 107 mitochondria from 3 technical replicates). Scale bar: 100 nm. Data represents mean ± SEM. *p < 0.05, **p < 0.01 by two-tailed student’s t-test.
Fig. 4
Fig. 4. Impaired spontaneous electrical activity and synaptic network formation in ABCA7/ iPSC-derived neurons.
A Spontaneous firing patterns in neurons derived from isogenic control and ABCA7/ iPSCs were measured by MED64 PRESTO 7 weeks after differentiation from NPCs. Each spike is indicated with a yellow arrow. B The frequency of spontaneous firing was monitored in the iPSC neurons for 7 weeks after differentiation (n = 9–10 technical replicates from 2 isogenic lines (#1 and #2)/group). C Extracellular recordings of spontaneous firing including burst firing (red rectangles) in the iPSC-derived neurons were measured by MED64 PRESTO 7 weeks after differentiation. D The incidence of burst firing was monitored in the iPSC neurons for 7 weeks after differentiation (n = 9–10 technical replicates from 2 isogenic lines (#1 and #2)/group). Data represents mean ± SEM. *p < 0.05, ***p < 0.001 by two-tailed student’s t-test at week 7.
Fig. 5
Fig. 5. Restored mitochondrial respiration and synaptic function by supplementation with NMN or PG in ABCA7/ iPSC-derived neurons.
A, B, E, F Mitochondrial respiration in neurons derived from isogenic control and ABCA7/ iPSCs (#1) was measured by Mito Stress Test Kit through Seahorse XFe96 Extracellular Flux Analyzer with PG_18:2-18:2 (A, B; 50 µM) or NMN (E, F; 100 µM) administration for 1 day 7 weeks after differentiation from NPCs. DMSO or DDW was used as a control, respectively. The OCR measurements were normalized with cell density determined by nuclear DNA staining with DAPI (n = 5–7 technical replicates/group). A.U., arbitrary unit. C, G Frequency of spontaneous firing was measured in the control and ABCA7/neurons (#1) before and after administration with PG_18:2-18:2 (C; 50 µM), NMN (G; 100 µM), or respective controls (n = 7–8 technical replicates/group). Data were normalized to those before adding the compound. D, H The ABCA7/neurons (#1) were treated with PG_18:2-18:2 (D; 50 µM), NMN (H; 100 µM), or respective controls 1 week after the differentiation into neurons for 7 weeks and number of burst firings represents were monitored (n = 4–5 technical replicates/group). Data represents mean ± SEM. *p < 0.05, **p < 0.01, ***p < 0.001, ****p < 0.0001 by paired t-tests (C, G), Tukey–Kramer post hoc analysis of Two-way ANOVA (B, F) or repeated measures two-way ANOVA (D, H).
Fig. 6
Fig. 6. Mitochondrial morphological changes and synaptic loss in synaptosomes extracted from neuron-specific Abca7 knockout mice.
A The schematic process of Abca7floxp allele generation is shown. B Neuron-specific Abca7 knockout (nAbca7−/−) mice and control mice were generated by crossing Abca7floxp/floxp mice with Camk2a-Cre+/ mice. Representative images of immunostaining for ABCA7, NeuN, and GFAP in the hippocampus from the mice are shown. Nuclei were stained with DAPI. Scale bars: 100 µm. C Synaptosomes were extracted from the mouse brains at the age of 20 months and ABCA7 levels were assessed by Western blotting. Data were normalized to those of βIII-tubulin. (N = 4 male mice/group). D, E Electron microscope images of synaptosomes derived from the mice. The length, width, area, and perimeter of mitochondria were measured with ImageJ. Scale bar: 200 nm. (Control: n = 62 from 3 male mice, nABCA7−/−: n = 69 from 3 male mice). F Amounts of presynaptic protein (SNAP25) and postsynaptic protein (PSD95) in the synaptosomes were assessed by Western blotting. Data were normalized to those of control lines. (N = 6 male mice/group). G Expressions of Snap25 and Dlg4 mRNA in the cortex of the mouse brain were measured by qRT-PCR and normalized by Gapdh mRNA level (N = 7 male mice/group). Data represents mean ± SEM. *p < 0.05, **p < 0.01, ***p < 0.001 by two-tailed student’s t-test.

References

    1. Alzheimer’sAssociation. 2023 Alzheimer’s disease facts and figures. Alzheimers Dement. 2023;19:1598–695. doi: 10.1002/alz.13016. - DOI - PubMed
    1. Breijyeh Z, Karaman R. Comprehensive review on Alzheimer’s disease: causes and treatment. Molecules. 2020;25:5789. doi: 10.3390/molecules25245789. - DOI - PMC - PubMed
    1. Bellenguez C, Kucukali F, Jansen IE, Kleineidam L, Moreno-Grau S, Amin N, et al. New insights into the genetic etiology of Alzheimer’s disease and related dementias. Nat Genet. 2022;54:412–36. doi: 10.1038/s41588-022-01024-z. - DOI - PMC - PubMed
    1. Hollingworth P, Harold D, Sims R, Gerrish A, Lambert JC, Carrasquillo MM, et al. Common variants at ABCA7, MS4A6A/MS4A4E, EPHA1, CD33 and CD2AP are associated with Alzheimer’s disease. Nat Genet. 2011;43:429–35. doi: 10.1038/ng.803. - DOI - PMC - PubMed
    1. Karch CM, Goate AM. Alzheimer’s disease risk genes and mechanisms of disease pathogenesis. Biol Psychiatry. 2015;77:43–51. doi: 10.1016/j.biopsych.2014.05.006. - DOI - PMC - PubMed

Substances