. 2023 Dec 22;13(1):232.
doi: 10.1186/s13578-023-01185-2.

NUAK1 coordinates growth factor-dependent activation of mTORC2 and Akt signaling

Affiliations

NUAK1 coordinates growth factor-dependent activation of mTORC2 and Akt signaling

Mario Palma et al. Cell Biosci. .

Abstract

Background: mTORC2 is a critical regulator of cytoskeleton organization, cell proliferation, and cancer cell survival. Activated mTORC2 induces maximal activation of Akt by phosphorylation of Ser-473, but regulation of Akt activity and signaling crosstalk upon growth factor stimulation are still unclear.

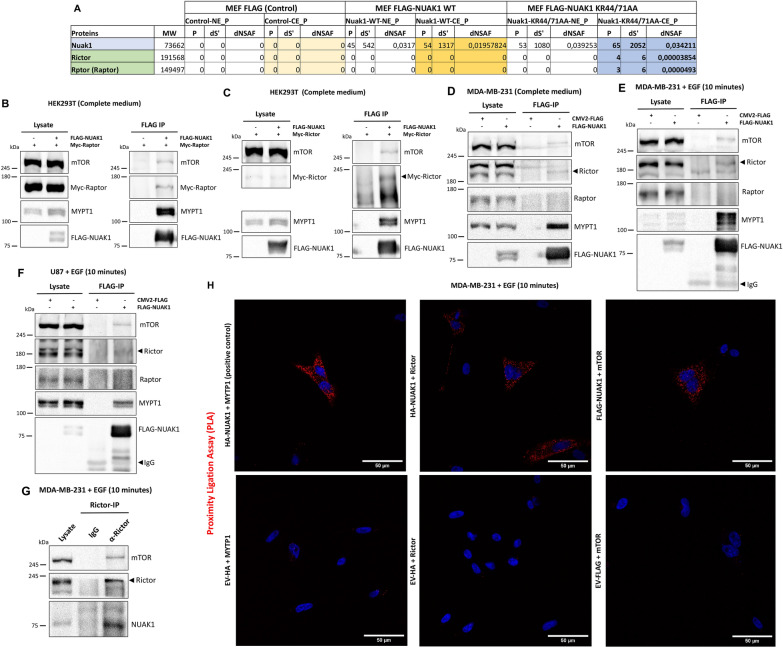
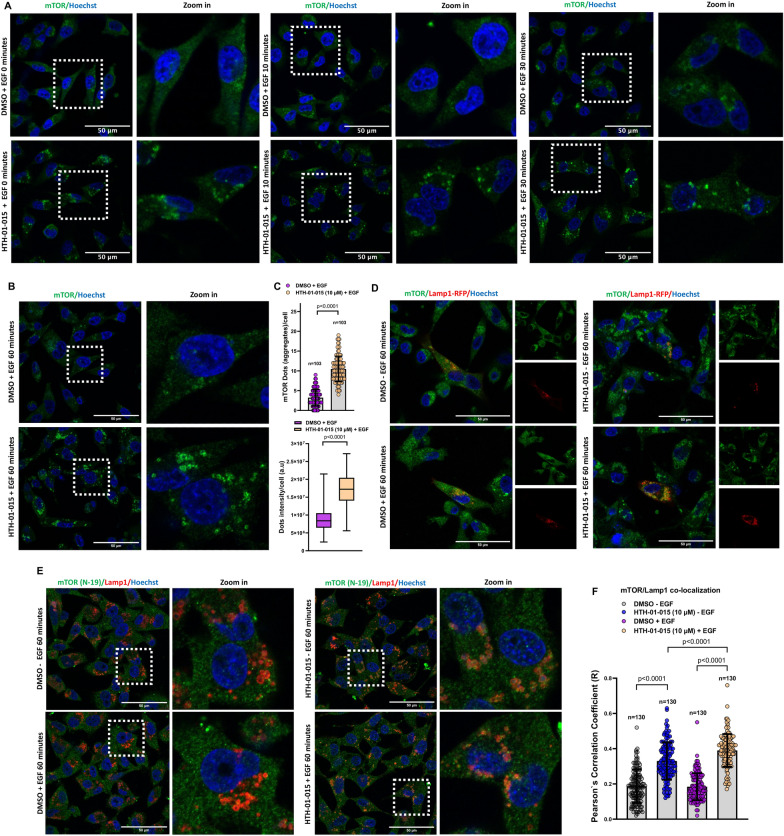
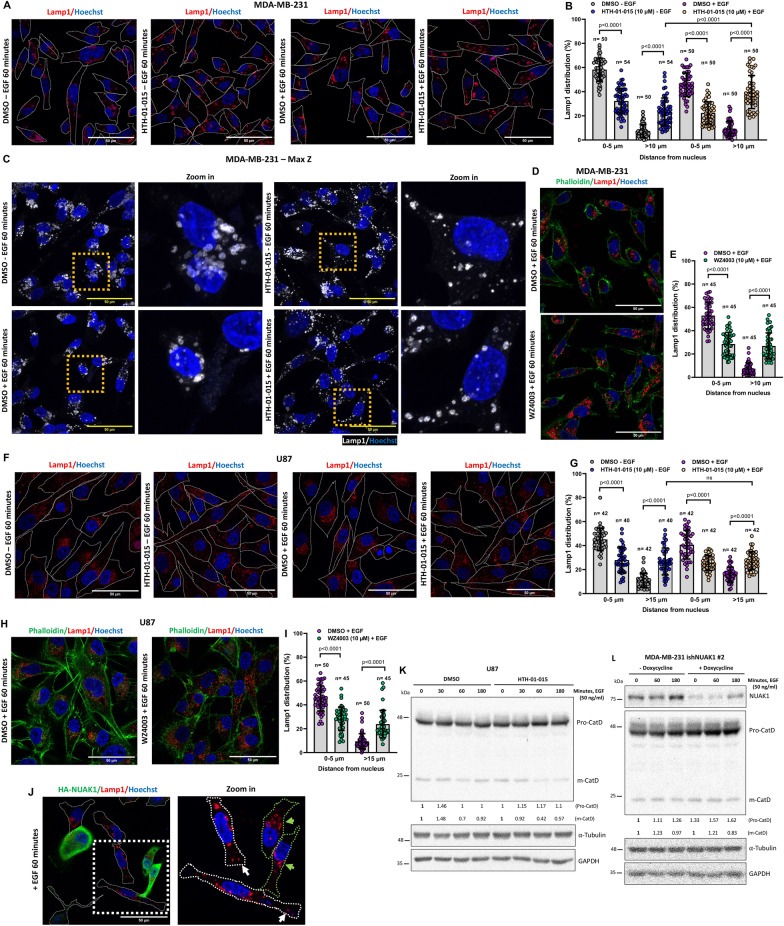
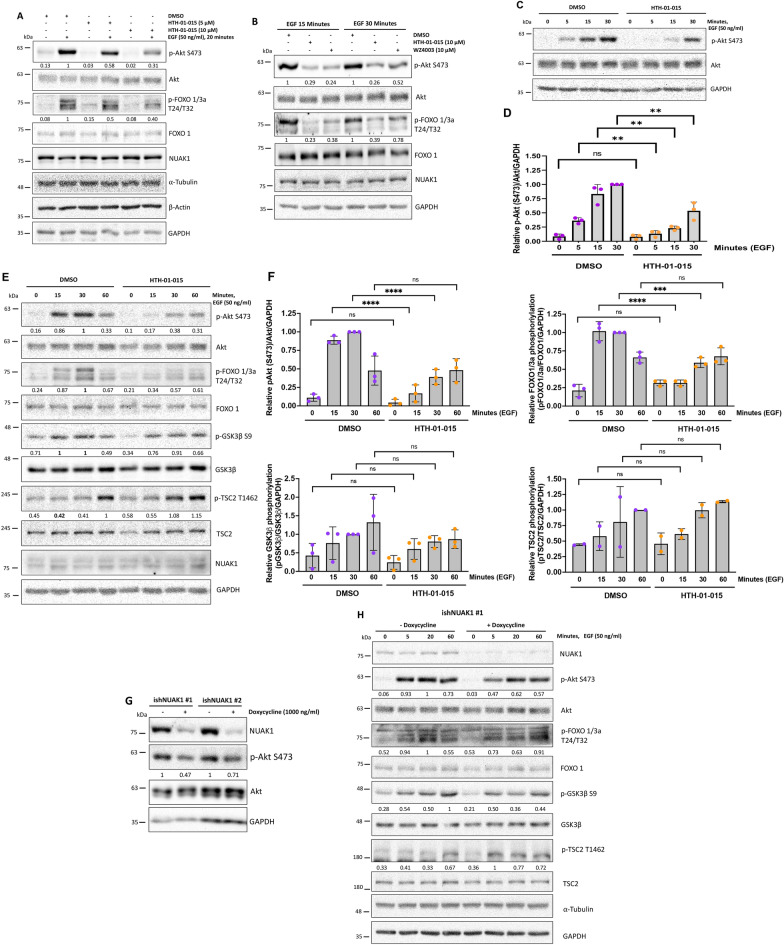
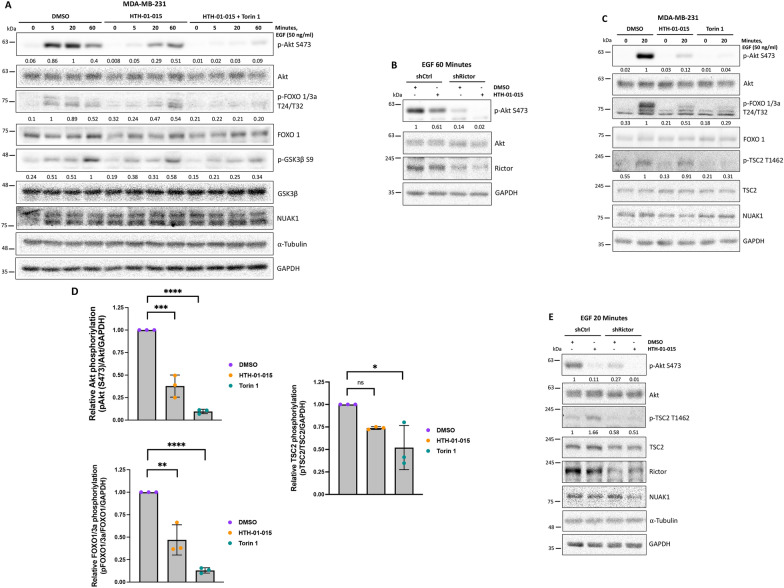
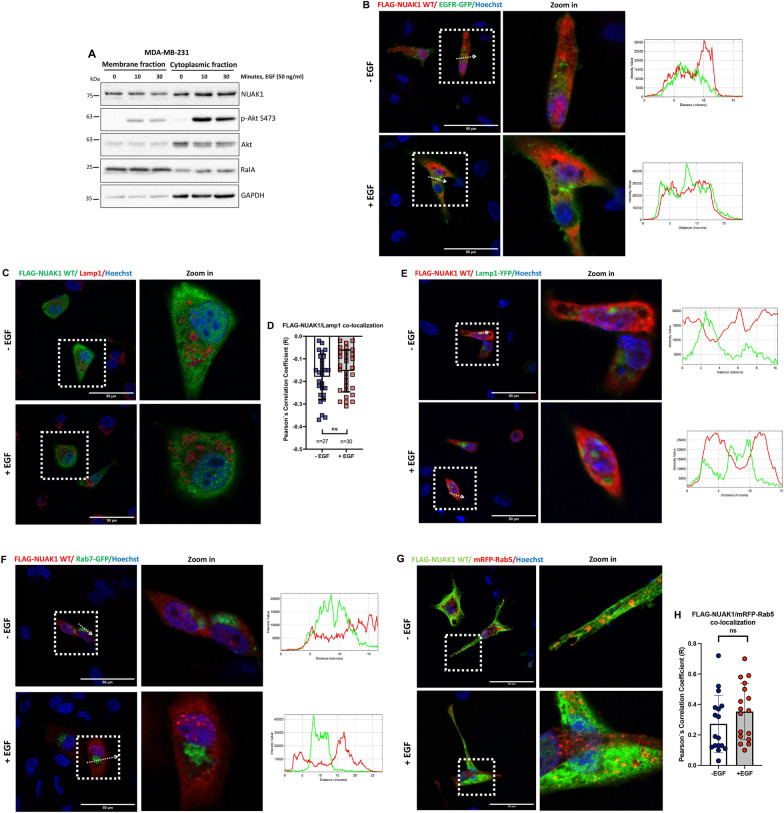
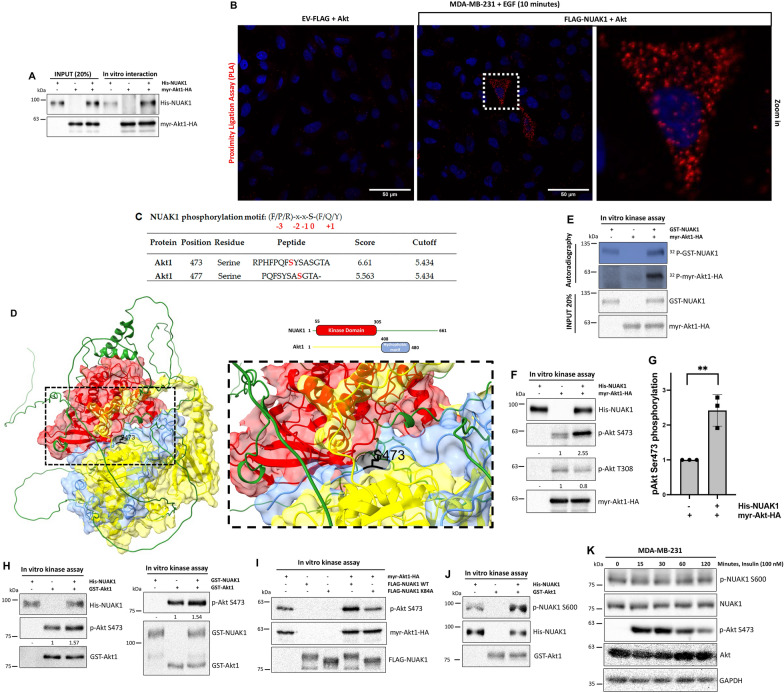
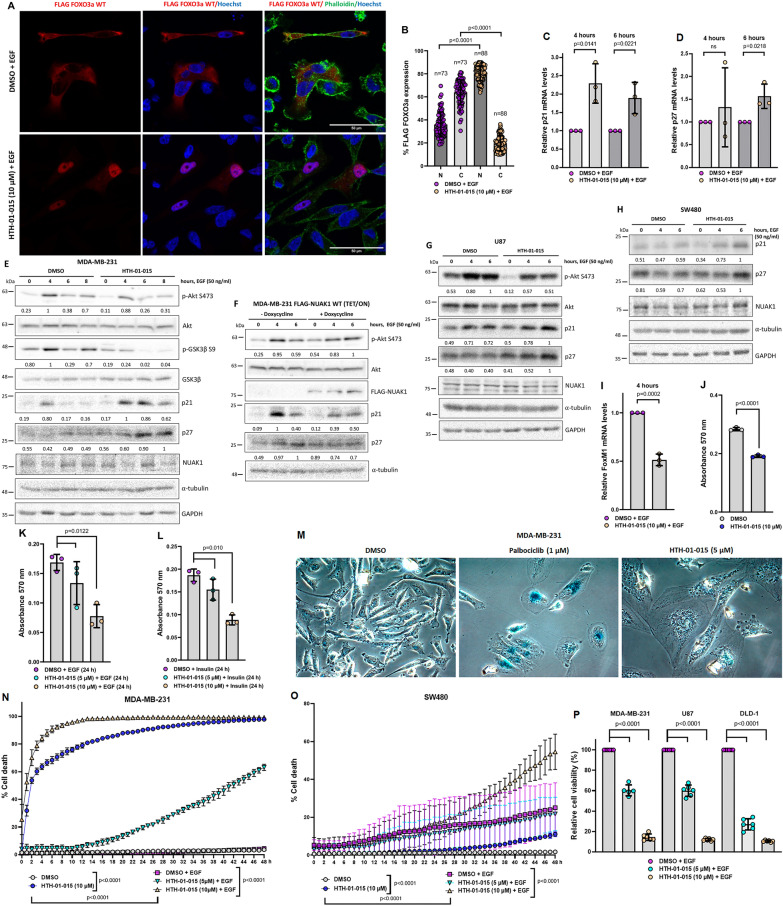
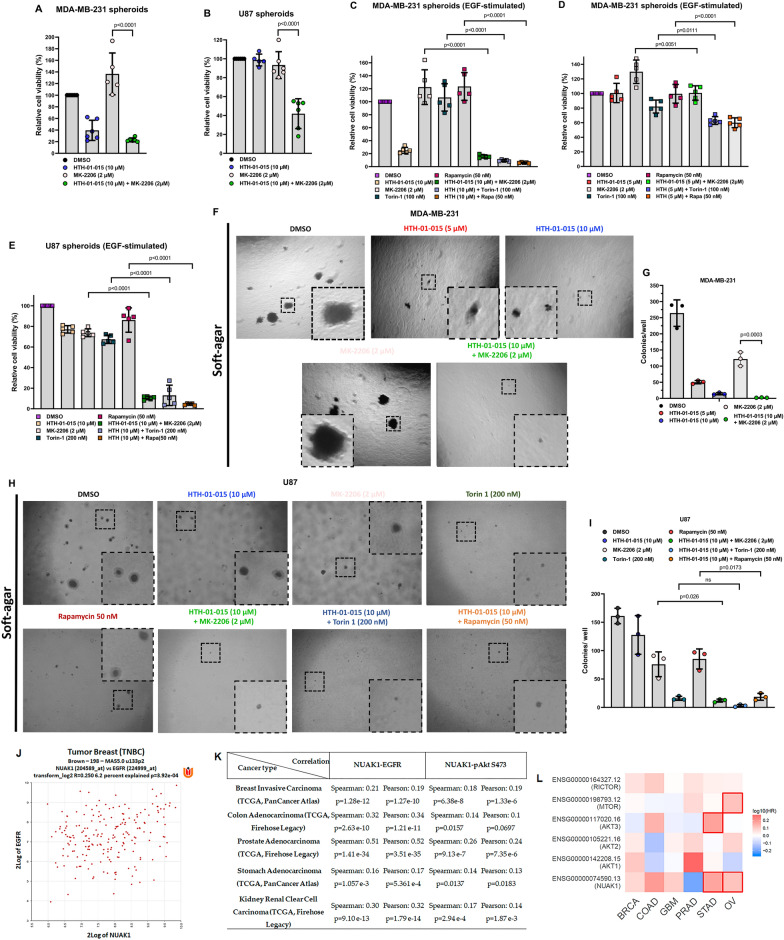
Results: We identified that NUAK1 regulates growth factor-dependent activation of Akt by two mechanisms. NUAK1 interacts with mTORC2 components and regulates mTORC2-dependent activation of Akt by controlling lysosome positioning and mTOR association with this organelle. A second mechanism involves NUAK1 directly phosphorylating Akt at Ser-473. The effect of NUAK1 correlated with a growth factor-dependent activation of specific Akt substrates. NUAK1 induced the Akt-dependent phosphorylation of FOXO1/3a (Thr-24/Thr-32) but not of TSC2 (Thr-1462). According to a subcellular compartmentalization that could explain NUAK1's differential effect on the Akt substrates, we found that NUAK1 is associated with early endosomes but not with plasma membrane, late endosomes, or lysosomes. NUAK1 was required for the Akt/FOXO1/3a axis, regulating p21CIP1, p27KIP1, and FoxM1 expression and cancer cell survival upon EGFR stimulation. Pharmacological inhibition of NUAK1 potentiated the cell death effect induced by Akt or mTOR pharmacological blockage. Analysis of human tissue data revealed that NUAK1 expression positively correlates with EGFR expression and Akt Ser-473 phosphorylation in several human cancers.

Conclusions: Our results showed that NUAK1 kinase controls mTOR subcellular localization and induces Akt phosphorylation, demonstrating that NUAK1 regulates the growth factor-dependent activation of Akt signaling. Therefore, targeting NUAK1, or co-targeting it with Akt or mTOR inhibitors, may be effective in cancers with hyperactivated Akt signaling.

Keywords: Akt; Cancer signaling; Co-targeting; NUAK1; mTORC2.


Conflict of interest statement

The authors declare no competing interests.

Figures

Fig. 1
Fig. 1
NUAK1 interacts with mTOR and Rictor but not with Raptor upon EGF stimulation. A Table shows total peptide count (P), the distributed spectra count (dS), and distributed normalized spectral abundance (dNSAF), observed for each identified protein in murine FLAG-NUAK1 WT and FLAG-NUAK1 KR44/71AA purifications (n = 3). NE, nuclear extract; CE, cytoplasmic extract. B Immunoblot (IB) of the Immunoprecipitation (IP) of human FLAG-NUAK1 WT and CoIP of endogenous mTOR, MYPT1 and exogenous Myc-Raptor in HEK293T cells. C IB of the IP of FLAG-NUAK1 WT and CoIP of endogenous mTOR, MYPT1 and exogenous Myc-Rictor in HEK293T cells. D IB of the IP of FLAG-NUAK1 WT and CoIP of endogenous mTOR, Rictor, Raptor and MYPT1 in MDA-MB-231 cells. EF IB of the IP of FLAG-NUAK1 WT and CoIP of endogenous mTOR, Rictor, Raptor and MYPT1 from MDA-MB-231 (E) and U87 (F) cells serum-starved overnight before stimulation with EGF by 10 min. G IB of the IP of endogenous Rictor and CoIP of endogenous mTOR, and NUAK1 in MDA-MB-231 cells serum-starved overnight before stimulation with EGF by 10 min. H Proximity ligation assay (PLA) in MDA-MB-231 cells expressing HA-tagged NUAK1, FLAG-tagged NUAK1 or Empty vector (EV) (used as a negative control). Cells were serum-starved overnight and stimulated with EGF by 10 min (n = 3). Red dots indicate proximity of HA-NUAK1 with MYPT1 (Positive control), HA-NUAK1 with Rictor or FLAG-NUAK1 with mTOR. DAPI was used as a nuclear counterstain
Fig. 2
Fig. 2
NUAK1 inhibition induces mTOR accumulation at the lysosome. A Representative confocal images of mTOR under NUAK1 inhibition. MDA-MB-231 cells were serum-starved overnight followed by 90 min of pretreatment with DMSO or HTH-01-015 (10 µM) before EGF stimulation for 0, 10, and 30 min. Green, mTOR; Blue, nuclei. B Representative confocal images of mTOR under NUAK1 inhibition. MDA-MB-231 cells were serum-starved overnight followed by 90 min of pretreatment with DMSO or HTH-01-015 (10 µM) and EGF-stimulated for 60 min. Green, mTOR; Blue, nuclei. C Quantification of the number of dots (upper) and intensity (lower) from B. Each bar represents the mean ± SD, Student t test. D Representative confocal images of mTOR and Lamp1-RFP after NUAK1 inhibition from non-stimulated or EGF-stimulated MDA-MB-231 cells for 60 min. Left, merge; Right, mTOR and Lamp1-RFP images. Green, mTOR; Red, Lamp1-RFP; Blue, nuclei. E Representative confocal images of endogenous mTOR (N-19) and Lamp1 in MDA-MB-231 cells after NUAK1 inhibition from non-stimulated or EGF-stimulated cells for 60 min. Left, merge; Right, zoom in. Green, mTOR (N-19); Red, Lamp1; Blue, nuclei. F Quantification of mTOR/Lamp1 co-localization from E. Each bar represents the mean ± SD, Student t test
Fig. 3
Fig. 3
NUAK1 inhibition induces peripheral lysosomal positioning. A, F Representative confocal images of lysosomes using an anti-Lamp1 antibody (lysosome marker) in MDA-MB-231 (A) and U87 cells (F) under HTH-01-015 treatment. MDA-MB-231 and U87 cells were serum-starved overnight followed by 90 min of pretreatment with DMSO or HTH-01-015 (10 µM) and non-stimulated or EGF-stimulated for 60 min. Cells borders were marked with a boundary. Red, Lamp1; Blue, nuclei. B, G Quantification of the distribution of Lamp1+-lysosomes from A and F, respectively. Each bar represents the mean ± SD, Student t test. C Representative z-stack projections of Lamp1+-lysosomes in MDA-MB-231 cells. D, H Representative confocal images of lysosomes in MDA-MB-231 (D) and U87 cells (H) under WZ4003 treatment. Cells were serum-starved overnight followed by 90 min of pretreatment with DMSO or WZ4003 (10 µM) before stimulation with EGF for 60 min. Green, Phalloidin (F-actin); Red, Lamp1; Blue, nuclei. E, I Quantification of the distribution of Lamp1+-lysosomes from D and H, respectively. Each bar represents the mean ± SD, Student t test. J Representative confocal images of lysosomes in MDA-MB-231 expressing HA-tagged NUAK1 and stimulated with EGF for 60 min. Cells borders were marked with a boundary. Green, HA-NUAK1; Red, Lamp1; Blue, nuclei. K IB of Cathepsin D under NUAK1 inhibition in U87 cells. L IB of Cathepsin D under NUAK1 depletion in MDA-MB-231 cells
Fig. 4
Fig. 4
NUAK1 regulates Akt signaling under growth factors stimulation. A IB of Akt signaling under NUAK1 inhibition in MDA-MB-231 cells serum-starved overnight followed by 1-h of pretreatment with DMSO or HTH-01-015 (5 µM and 10 µM) before stimulation with EGF for 20 min. B IB of Akt signaling under NUAK1/2 inhibitors in MDA-MB-231 cells serum-starved overnight followed by 1-h of pretreatment with DMSO, HTH-01-015 (10 µM) or WZ4003 (10 µM) before stimulation with EGF for 15 and 30 min. C IB of Akt signaling under NUAK1 inhibition in MDA-MB-231 cells serum-starved overnight followed by 1-h of pretreatment with DMSO or HTH-01-015 (10 µM) before stimulation with EGF for 0, 5, 15, and 30 min. D Quantification of Akt phosphorylation at Ser-473 from C. Each bar represents the mean ± SD, n = 3. Data from 3 independent were analyzed by one-way ANOVA followed by Turkey’s multiple comparison test. E IB of Akt signaling under NUAK1 inhibition in MDA-MB-231 cells serum-starved overnight followed by 1-h of pretreatment with DMSO or HTH-01-015 (10 µM) before stimulation with EGF for 0, 15, 30 and 60 min. F Quantification of Akt phosphorylation at Ser-473 from E. Each bar represents the mean ± SD, n = 3. Data from 3 independent experiments (two for pTSC2) were analyzed by one-way ANOVA followed by Turkey’s multiple comparison test. G IB of Akt Ser-473 phosphorylation using inducible shRNAs for NUAK1. MDA-MB-231 cells stable expressing inducible shRNA vectors for NUAK1 [#1 (left) and #2 (right)] were pretreated with doxycycline or vehicle (used as a negative control) by 4 days. H IB of Akt signaling using inducible shRNA for NUAK1. MDA-MB-231 cells stable expressing inducible shRNA vector for NUAK1 #1 were pretreated with doxycycline or vehicle (used as a negative control) for 3 days followed by serum starvation overnight (with or without doxycycline) before stimulation with EGF. α-tubulin and/or GAPDH were used as loading controls
Fig. 5
Fig. 5
Comparative of NUAK1 inhibition versus mTOR inhibition on Akt signaling. A IB of combined inhibition of NUAK1 and mTOR on Akt signaling. MDA-MB-231 cells were serum-starved overnight followed by 1-h of pretreatment with DMSO, HTH-01-015 (10 µM) or HTH-01-015 (10 µM) plus Torin1 (100 nM) before stimulation with EGF. B IB of Akt Ser-473 phosphorylation under NUAK1 inhibition in MDA-MB-231 shCtrl and MDA-MB-231 shRictor cells. Stable cells were serum-starved overnight followed by 1-h of pretreatment with DMSO or HTH-01-015 (10 µM) before stimulation with EGF for 60 min. C IB of NUAK1 and mTOR effect on Akt signaling. MDA-MB-231 cells were serum-starved overnight followed by 1-h of pretreatment with DMSO, HTH-01-015 (10 µM) or Torin1 (100 nM) before stimulation with EGF for 0 and 20 min. D Quantification of Akt signaling pathway from C. Each bar represents the mean ± SD, n = 3. Data from 3 independent experiments at 20 min of EGF stimulation were analyzed by student t test. E IB of Akt/TSC2 signaling under NUAK1 inhibition in MDA-MB-231 shCtrl and MDA-MB-231 shRictor cells. Stable cells were serum-starved overnight followed by 1-h pretreatment with DMSO or HTH-01-015 (10 µM) before stimulation with EGF for 20 min. GAPDH and/or α-tubulin were used as loading controls
Fig. 6
Fig. 6
NUAK1 is localized at early-endosomes but not at the PM, lysosomes, and late-endosomes. A IB of NUAK1 subcellular location. Subcellular fractionation of the membrane and cytoplasmic fractions of MDA-MB-231 cells after 0, 10 and 30 min of EGF stimulation. p-Akt S473 was used as a positive control. RalA was used as a control for the membrane fraction. GAPDH was used as a control for the cytoplasmic fraction. BC Immunofluorescence (IF) of MDA-MB-231 cells after 0 (−EGF) and 15 (+EGF) minutes of EGF stimulation. B Left, Representative confocal images for FLAG-NUAK1 WT and EGFR-GFP, arrows indicate the distance (µm) analyzed; Right, Histogram of the fluorescence intensity profile across the arrow for both red and green channels. Red, FLAG-Tagged-NUAK1; Green, EGFR-GFP (PM marker); Blue, nuclei. C Representative confocal images for FLAG-NUAK1 WT and Lamp1. Green, FLAG-Tagged-NUAK1; Red, endogenous Lamp1 (lysosome marker); Blue, nuclei. D Quantification of FLAG-NUAK1/Lamp1 co-localization from C. Each bar represents the mean ± SD, not significant (ns), Student t test. E IF of MDA-MB-231 cells after 0 (−EGF) and 30 (+EGF) minutes of EGF stimulation. Left, Representative confocal images for FLAG-NUAK1 WT and Lamp1-YFP, arrows indicate the distance (µm) analyzed; Right, Histogram of the fluorescence intensity profile across the arrow for both red and green channels. Red, FLAG-Tagged-NUAK1; Green, Lamp1-YFP (lysosome marker); Blue, nuclei. F IF of MDA-MB-231 cells after 0 (−EGF) and 15 (+EGF) minutes of EGF stimulation. Left, Representative confocal images for FLAG-NUAK1 WT and Rab7-GFP, arrows indicate the distance (µm) analyzed; Right, Histogram of the fluorescence intensity profile across the arrow for both red and green channels. Red, FLAG-Tagged-NUAK1; Green, Rab7-GFP (late-endosome marker); Blue, nuclei. G IF of MDA-MB-231 cells after 0 (−EGF) and 30 (+EGF) minutes of EGF stimulation. Representative confocal images for FLAG-NUAK1 WT and mRFP-Rab5. Green, FLAG-Tagged-NUAK1; Red, mRFP-Rab5 (early-endosome marker); Blue, nuclei. H Quantification of FLAG-NUAK1/mRFP-Rab5 co-localization from G. Each bar represents the mean ± SD, not significant (ns), Student t test
Fig. 7
Fig. 7
NUAK1 interacts with Akt and phosphorylates it at Ser-473. A IB of NUAK1 and Akt1 in vitro interaction. Recombinant His-tagged NUAK1 and immunoprecipitated HA-tagged Akt1 were used. B Proximity ligation assay (PLA) in MDA-MB-231 cells expressing FLAG-tagged NUAK1 or Empty vector (EV) (used as a negative control) were serum-starved overnight and stimulated with EGF by 10 min (n = 3). Red dots indicate proximity of FLAG-NUAK1 and Akt. DAPI was used as a nuclear counterstain. C Table of putative phosphoresidues phosphorylated by NUAK1 on Akt1. A consensus phosphorylation motif for NUAK1 obtained from GPS5.0 was used. D Molecular docking between NUAK1-Akt1. NUAK1 kinase domain (Red), Akt hydrophobic motif (Blue), and Ser-473 (Black) are represented. E Autoradiography of in vitro kinase assay using recombinant active GST-tagged NUAK1 and purified Akt1 HA-tagged. F IB of in vitro kinase assay using recombinant active His-tagged NUAK1 and purified Akt1 HA-tagged. Akt Ser-473 and Thr-308 phosphorylation were determined using specific antibodies. G Quantification of Akt S473 phosphorylation from F. Each bar represents the mean ± SD, n = 3. Data from 3 independent experiments were analyzed by Student t test. H IB of in vitro kinase assays using recombinant His-tagged NUAK1 and recombinant GST-tagged Akt1 (left) or recombinant active GST-tagged NUAK1 and recombinant GST-tagged Akt1 (right), respectively. I IB of in vitro kinase assays using purified FLAG-NUAK1 WT or FLAG-NUAK1 K84A (kinase-dead) and purified Akt1 HA-tagged. J IB of in vitro kinase assay using recombinant active GST-tagged Akt1 and recombinant His-tagged NUAK1. NUAK1 Ser-600 phosphorylation was determined using a specific antibody. All kinase assays were performed at least three times, except the kinase assay in J, that was performed two times. K IB of Akt signaling and NUAK1 phosphorylation at Ser-600 after insulin stimulation. GAPDH was used as loading control
Fig. 8
Fig. 8
NUAK1 regulates FOXO3a subcellular localization, the expression of p21CIP1, p27KIP1, FoxM1, and cancer cell survival. A Representative confocal images of FLAG-tagged FOXO3a under NUAK1 inhibition. MDA-MB-231 cells expressing FLAG-tagged FOXO3a were serum-starved overnight followed by 1-h of pretreatment with DMSO or HTH-01-015 (10 µM) before 60 min of stimulation with EGF. Red, FLAG FOXO3a; Green, Phalloidin (F-actin); Blue, nuclei. B Quantification in % of FLAG-tagged FOXO3a expression from MDA-MB-231 IF experiments from A. N = nuclear fraction. C = Cytoplasmic fraction. Each bar represents the mean ± SD, Student t test. CE p21 and p27 expression under NUAK1 inhibition. MDA-MB-231 cells were serum-starved overnight followed by 1-h of pretreatment with DMSO or HTH-01-015 (10 µM) before stimulation with EGF for 4 and 6 h for mRNA levels (C, D) (each bar represents the mean ± SD. Student t test, n = 3), and 0, 4, 6 and 8 h for protein levels (E). F IB of p21 and p27 expression under NUAK1 overexpression. MDA-MB-231 cells stable for FLAG-tagged NUAK1 inducible expression were pretreated with doxycycline or vehicle (used as a negative control) by 12 h followed by serum-starved overnight (with or without doxycycline) before stimulation with EGF for 0, 4 and 6 h. GH IB of p21 and p27 expression under NUAK1 inhibition in U87 (G) and SW480 (H) cells serum-starved overnight followed by 1-h of pretreatment with DMSO or HTH-01-015 (10 µM) before stimulation with EGF for 0, 4 and 6 h. All IB are representative of at least three independent experiments. GAPDH and/or α-tubulin were used as loading controls. I FoxM1 mRNA levels under NUAK1 inhibition. MDA-MB-231 cells were serum-starved overnight followed by 1-h of pretreatment with DMSO or HTH-01-015 (10 µM) before stimulation with EGF for 4 h. Each bar represents the mean ± SD, Student t test, n = 3. J Quantification of the crystal violet staining to evaluate NUAK1 effect on cell number under complete medium. MDA-MB-231 cells were treated with DMSO or HTH-01-015 (10 µM) for 24 h. Each bar represents the mean ± SD, Student t test, n = 3. KL Quantification of the crystal violet staining to evaluate NUAK1 effect on cell number under EGF- or insulin-stimulation. MDA-MB-231 cells were serum-starved overnight followed by 1-h pretreatment with DMSO or HTH-01-015 (5 µM or 10 µM) before stimulation with EGF (K) or Insulin (L) for 24 h. Each bar represents the mean ± SD, one-way ANOVA, n = 3. M NUAK1 effect on senescence. MDA-MB-231 cells were treated with DMSO, Palbociclib (1 µM) (used as a positive control) or HTH-01-015 (5 µM) for 4 days (n = 3). NO NUAK1 effect on cell death in MDA-MB-231 (N) and SW480 (O) cells under normal growth conditions or EGF stimulation using Incucyte. Each bar represents the mean ± SD, Student t test, n = 5 or one‐way ANOVA, n = 5. P NUAK1 effect on cell viability in spheroids from MDA-MB-231, U87, and DLD-1 cells. Spheroids were pretreated with DMSO or HTH-01-015 (5 µM or 10 µM) before stimulation with EGF for 96 h. Each bar represents the mean ± SD, one‐way ANOVA, n = 6
Fig. 9
Fig. 9
NUAK1 inhibition synergies with Akt or mTOR blockage. A, B Effect of co-targeting NUAK1 and Akt on cell viability of spheroids (3D culture) from MDA-MB-231 (A) and U87 (B) for 96 h. Cell viability measurements were described in METHODS. Each bar represents the mean ± SD, n = 5. Data were analyzed by one-way ANOVA (P < 0.0001 for A, B) followed by Tukey’s test (MK-2206 compared to MK-2206 plus HTH-01-015, P < 0.0001 for A, B). CD Effect of co-targeting NUAK1 and Akt or mTOR on cell viability of spheroids from MDA-MB-231 cells EGF-stimulated for 48 h. HTH-01-015, 10 µM (C) or HTH-01-015, 5 µM (D). Each bar represents the mean ± SD, n = 5. Data from C were analyzed by one-way ANOVA (P < 0.0001 for Akt and NUAK1 Co-targeting; P < 0.0001 for mTOR and NUAK1 Co-targeting; P < 0.0001 for mTORC1 and NUAK1 Co-targeting) followed by Tukey’s test (MK-2206 compared to MK-2206 plus HTH-01-015, P < 0.0001; Torin 1 compared to Torin 1 plus HTH-01-015, P < 0.0001; Rapamycin compared to Rapamycin plus HTH-01-015, P < 0.0001). Data from D were analyzed by one-way ANOVA (P = 0.0016 for Akt and NUAK1 Co-targeting; P < 0.0001 for mTOR and NUAK1 Co-targeting; P < 0.0001 for mTORC1 and NUAK1 Co-targeting) followed by Tukey’s test (MK-2206 compared to MK-2206 plus HTH-01-015, P = 0.0051; Torin 1 compared to Torin1 plus HTH-01-015, P = 0.0111; Rapamycin compared to Rapamycin plus HTH-01-015, P < 0.0001). E Effect of co-targeting NUAK1 and Akt or mTOR on cell viability of spheroids from U87 cells EGF-stimulated by 48 h. Each bar represents the mean ± SD, n = 5. Data from E were analyzed by one-way ANOVA (P < 0.0001 for Akt and NUAK1 Co-targeting; P < 0.0001 for mTOR and NUAK1 Co-targeting; P < 0.0001 for mTORC1 and NUAK1 Co-targeting) followed by Tukey’s test (MK-2206 compared to MK-2206 plus HTH-01-015, P < 0.0001; Torin 1 compared to Torin 1 plus HTH-01-015, P < 0.0001; Rapamycin compared to Rapamycin plus HTH-01-015 (10 µM), P < 0.0001). F Soft-agar colony formation assays in MDA-MB-231 cells (Zoom ×4). G Quantification of number of colonies per well from F. Each bar represents the mean ± SD, n = 3. Data from G were analyzed by one-way ANOVA (P < 0.0001) followed by Tukey’s test (MK-2206 compared to MK-2206 plus HTH-01-015, P = 0.0003). H Soft-agar colony formation assays in U87 cells (Zoom ×4). I Quantification of number of colonies per well from H. Each bar represents the mean ± SD, n = 3. Data from I were analyzed by one-way ANOVA (P = 0.0001 for Akt and NUAK1 Co-targeting; P < 0.0001 for mTOR and NUAK1 Co-targeting; P = 0.0002 for mTORC1 and NUAK1 Co-targeting) followed by Tukey’s test (MK-2206 compared to MK-2206 plus HTH-01-015, P = 0.026; Torin 1 compared to Torin1 plus HTH-01-015, not significant (ns); Rapamycin compared to Rapamycin plus HTH-01-015, P = 0.0173). J Correlation between NUAK1 and EGFR expression in TNBC (Brown n = 198, MAS5.0 u133p2) from R2: Genomics Analysis and Visualization Platform. K Correlation between NUAK1 and EGFR expression, and NUAK1 expression and Akt Ser-473 phosphorylation in Breast Invasive carcinoma (n = 874), COAD (n = 636), Prostate Adenocarcinoma (n = 498), STAD (n = 440), and Kidney Renal Clear Cell Carcinoma (n = 537) from c-Bioportal. L Hazard Ratio (HR) plot for NUAK1, Akt1, Akt2, Akt3, mTOR, and Rictor in BRCA (Breast Carcinoma), COAD, GBM (Glioblastoma Multiforme), PRAD (Prostate Adenocarcinoma), STAD (Stomach Adenocarcinoma) and OV (Ovarian cancer) from Gepia2

References

    1. Liu GY, Sabatini DM. mTOR at the nexus of nutrition, growth, ageing and disease. Nat Rev Mol Cell Biol. 2020;21(4):183–203. doi: 10.1038/s41580-019-0199-y. - DOI - PMC - PubMed
    1. Saxton RA, Sabatini DM. mTOR signaling in growth, metabolism, and disease. Cell. 2017;168(6):960–976. doi: 10.1016/j.cell.2017.02.004. - DOI - PMC - PubMed
    1. Jia R, Bonifacino JS. Lysosome positioning influences mTORC2 and AKT signaling. Mol Cell. 2019;75(1):26–38e3. doi: 10.1016/j.molcel.2019.05.009. - DOI - PMC - PubMed
    1. Senoo H, Murata D, Wai M, Arai K, Iwata W, Sesaki H, Iijima M. KARATE: PKA-induced KRAS4B-RHOA-mTORC2 supercomplex phosphorylates AKT in insulin signaling and glucose homeostasis. Mol Cell. 2021;81(22):4622–4634e8. doi: 10.1016/j.molcel.2021.09.001. - DOI - PubMed
    1. Vanhaesebroeck B, Guillermet-Guibert J, Graupera M, Bilanges B. The emerging mechanisms of isoform-specific PI3K signalling. Nat Rev Mol Cell Biol. 2010;11(5):329–341. doi: 10.1038/nrm2882. - DOI - PubMed

LinkOut - more resources