. 2023 Nov 26;12(12):2045.
doi: 10.3390/antiox12122045.

Extracellular Vesicles and Their Renin-Angiotensin Cargo as a Link between Metabolic Syndrome and Parkinson's Disease

Affiliations

Extracellular Vesicles and Their Renin-Angiotensin Cargo as a Link between Metabolic Syndrome and Parkinson's Disease

Maria A Pedrosa et al. Antioxidants (Basel). .

Abstract

Several studies showed an association between metabolic syndrome (MetS) and Parkinson's disease (PD). The linking mechanisms remain unclear. MetS promotes low-grade peripheral oxidative stress and inflammation and dysregulation of the adipose renin-angiotensin system (RAS). Interestingly, brain RAS dysregulation is involved in the progression of dopaminergic degeneration and PD. Circulating extracellular vesicles (EVs) from MetS fat tissue can cross the brain-blood barrier and may act as linking signals. We isolated and characterized EVs from MetS and control rats and analyzed their mRNA and protein cargo using RT-PCR and the ExoView R200 platform, respectively. Furthermore, cultures of the N27 dopaminergic cell line and the C6 astrocytic cell line were treated with EVs from MetS rats. EVs were highly increased in MetS rat serum, which was inhibited by treatment of the rats with the angiotensin type-1-receptor blocker candesartan. Furthermore, EVs from MetS rats showed increased pro-oxidative/pro-inflammatory and decreased anti-oxidative/anti-inflammatory RAS components, which were inhibited in candesartan-treated MetS rats. In cultures, EVs from MetS rats increased N27 cell death and modulated C6 cell function, upregulating markers of neuroinflammation and oxidative stress, which were inhibited by the pre-treatment of cultures with candesartan. The results from rat models suggest EVs and their RAS cargo as a mechanism linking Mets and PD.

Keywords: NADPH-oxidase; adipocytes; angiotensin receptor blockers; exosomes; neurodegeneration; neuroinflammation; obesity; oxidative stress.


Conflict of interest statement

The authors declare no conflict of interest.

Figures
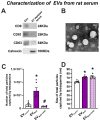
Figure 1
Figure 1
Expression of specific EV markers (CD9, CD81, CD63) and negative EV markers (calnexin) was confirmed by Western blotting in ExoQuick isolated samples (A). Transmission electron microscopy (TEM) visualization of EVMetS isolated using ExoQuick (B). Using the Exoview platform chip, captured particles from animal serum were increased in MetS rats and significantly decreased when MetS rats were treated with candesartan (C). Captured particles from MetS rats showed a larger size than those captured from control animals (D). Scale bar: 100 nm. Data are given as the mean ± SEM. * p < 0.05 relative to the control group; # p < 0.05 relative to the EVMetS. (Kruskal–Wallis one-way ANOVA with the Student-Newman-Keuls method as a post hoc test (C); one-way ANOVA with the Student-Newman-Keuls method as a post hoc test (D)). CAND: candesartan; EVs: extracellular vesicles; EVControl: EVS isolated from control animals; EVMetS: EVs isolated from the serum of metabolic syndrome animals; EVMetS+CAND: EVs isolated from the serum of metabolic syndrome animals treated with candesartan; MetS: metabolic syndrome.
Figure 2
Figure 2
mRNA-cargo of RAS components in EVs. Expression of pro-inflammatory components: AGT (A), AT1 (B), and PRR (C) was increased in EVMetS relative to EVControl, which was inhibited when MetS animals were treated with the AT1 receptor blocker candesartan. The expression of the anti-inflammatory component MasR (E) was increased in EVMetS+CAND. For mRNA, the comparative cycle threshold values method (2−ΔΔCt) was used. Data are given as the mean ± SEM. * p < 0.05 compared to the EVControl group; # p < 0.05 compared to the EVMetS group (Kruskal–Wallis one-way ANOVA with the Student-Newman-Keuls Method as a post hoc test (A); one-way ANOVA with the Student-Newman-Keuls Method as a post hoc test (BE)). ACE2: angiotensin-converting enzyme 2; AGT: angiotensinogen; AT1: angiotensin type 1 receptor, CAND: candesartan; EVs: extracellular vesicles; EVControl: EVs isolated from the serum of control animals; EVMetS: EVs isolated from the serum of metabolic syndrome animals; EVMetS+CAND: EVs isolated from the serum of metabolic syndrome animals treated with candesartan; MasR: Mas-related receptor; MetS: metabolic syndrome; PRR: (pro)-renin receptor.
Figure 3
Figure 3
Analysis of EVs from rat serum using SP-IRIS/ExoView®. An increase in the fluorescence intensity of the pro-inflammatory AT1 receptor (A) and a non-significant trend towards increasing the fluorescence intensity of PRR (B) was observed in EVMetS relative to EVControl captured by tetraspanins (i.e., total serum EVs). Similarly, a significant increase in AT1 (C) and a non-significant increase in PRR (D) fluorescence was observed in EVMetS when captured by Cav + Perlip (i.e., EVs from fat tissue). A tendency to decrease ACE2 levels (E,G), and a significant decrease in the levels of the anti-inflammatory Mas receptor was observed in EVMetS relative to EVControl both captured by tetraspanins (E,F) and by Cav + Perlip (G,H). Interestingly, EVs from MetS rats treated with candesartan (EVMetS+CAND) showed a significant increase in the fluorescence intensity of the anti-inflammatory components ACE2 (E,G) and MasR (F,H). Photographs (IK) show label-free interferometry (IFM) images of a representative anti-Caveolin capture chip from control rats (I), MetS rats (J), and MetS rats treated with candesartan (K). Pink (AT1 receptor), green (PRR), blue (ACE2), and red (MasR) fluorescence can be observed. Scale bars: 10 µm. Data are given as the mean ± SEM. * p < 0.05 compared to the EVControl group; # p < 0.05 compared to the EVMetS group (Kruskal–Wallis one-way ANOVA with the Student-Newman-Keuls method as a post hoc test (A,E,F); one-way ANOVA with the Student-Newman-Keuls method as a post hoc test (BD,G,H)). ACE2: angiotensin-converting enzyme 2; AT1: angiotensin type 1 receptor; CAND: candesartan; Cav: Caveolin; EVs: extracellular vesicles; EVControl: EVs isolated from the serum of control animals; EVMetS: EVs isolated from the serum of metabolic syndrome animals; EVMetS+CAND: EVs isolated from the serum of metabolic syndrome animals treated with candesartan; MasR: Mas-related receptor; MetS: metabolic syndrome; Perilip: Perilipin-1, PRR: (pro)-renin receptor.
Figure 4
Figure 4
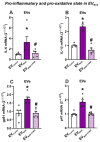
mRNA-cargo of pro-inflammatory and pro-oxidative markers in EVs. mRNA expressions of the pro-inflammatory interleukins IL-6 (A) and IL-1β (B), and the NADPH-oxidase gp91 (C) and p47 (D) subunits were increased in EVMetS relative to EVControl. The MetS-induced changes were inhibited when the MetS rats were treated with candesartan. For mRNA, the comparative cycle threshold values method (2−ΔΔCt) was used. Data are given as the mean ± SEM. * p < 0.05 compared to the control; # p < 0.05 compared to the EVMetS (Kruskal–Wallis one-way ANOVA with the Student-Newman-Keuls method as a post hoc test (A,D); one-way ANOVA with the Student-Newman-Keuls method as a post hoc test (B,C)). CAND: candesartan; EVs: extracellular vesicles; EVControl: EVs isolated from the serum of control animals; EVMetS: EVs isolated from the serum of metabolic syndrome animals; EVMetS+CAND: EVs isolated from the serum of metabolic syndrome animals treated with candesartan; IL: interleukin; MetS: metabolic syndrome.
Figure 5
Figure 5
N27 dopaminergic cell line and C6 astrocytic cell line uptake of EVMetS. Triple fluorescent labeling for (red) the cell marker β-Actin (A,E), the labeled-EVs (green; (B,F)), and the nuclear marker (blue) Hoechst 33342 (C,G). Labeled EVs were uptaken by N27 (D) and C6 (H) cells. The MTT assay revealed that EVMetS decreased the viability of the N27 dopaminergic cell line and that cultures simultaneously treated with 6-OHDA plus EVMetS showed a significant decrease in cell viability relative to the cultures treated with 6-OHDA alone. The decrease in dopaminergic viability was significantly improved when cultures were previously treated with candesartan (I). However, dopaminergic viability was not affected by the treatment of the N27 dopaminergic cell line with the vehicle (control) or EVs from control rats (EVControl) or candesartan alone (J). Scale bar: 20 µm. Data are given as the mean ± SEM. * p < 0.05 compared to the EVControl group; # p < 0.05 compared to the EVMetS group; $ p < 0.05 compared to the 6-OHDA group; & p < 0.05 compared to the 6-OHDA plus EVMetS group, (one-way ANOVA with the Student-Newman-Keuls method as a post hoc test (I) and Kruskal–Wallis one-way ANOVA (J)). 6-OHDA: 6-hydroxydopamine; CAND: candesartan; EVs: extracellular vesicles; EVControl: EVs isolated from the serum of control rats; EVMetS: EVs isolated from the serum of rats with metabolic syndrome; MetS: metabolic syndrome.
Figure 6
Figure 6
EVMetS uptake increased the mRNA expression of TNFα (A) and GFAP (B) in C6 cells and the release of TNFα (C), IL-6 (D), and IL-1β (E) to the culture medium. The effects of EVMetS were inhibited when cell cultures were simultaneously treated with the AT1 blocker candesartan. For mRNA, the comparative cycle threshold values method (2−ΔΔCt) was used. Data are given as the mean ± SEM. * p < 0.05 compared to the control group (i.e., cultures treated with the vehicle); # p < 0.05 relative to the EVMetS group; & p < 0.05 compared to EVControl (one-way ANOVA with the Student-Newman-Keuls Method as a post hoc test (AC); Kruskal–Wallis one-way ANOVA with the Student-Newman-Keuls Method as a post hoc test (D,E)). CAND: candesartan, EVs: extracellular vesicles; EVControl: EVs isolated from the serum of control rats; EVMetS: EVs isolated from the serum of metabolic syndrome animals; GFAP: glial fibrillary acidic protein; IL: interleukin, MetS: metabolic syndrome; TNFα: Tumor necrosis factor-alpha.
Figure 7
Figure 7
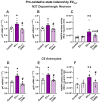
Oxidative stress induced by EVMetS in the N27 dopaminergic cell line and the C6 astrocytic cell line. The increased mRNA expression of p47phox (A,D) and gp91phox NADPH-oxidase subunits (B,E) and NADPH-oxidase activity (C,F) induced by EVMetS uptaking was inhibited when cells were treated with candesartan. For mRNA, the comparative cycle threshold values method (2−ΔΔCt) was used. NADPH oxidase activity was expressed as relative light units (RLU)/mg protein × min). Data are given as the mean ± SEM. * p < 0.05 relative to the control group; # p < 0.05 compared to the EVMetS group; & p < 0.05 compared to EVControl (One-way ANOVA with the Student-Newman-Keuls Method as a post hoc test (A,B,DF); Kruskal–Wallis one-way ANOVA with the Student-Newman-Keuls Method as a post hoc test (C)). CAND: candesartan; control group: cultures treated with vehicle; EVControl: EVs isolated from the serum of control rats; EVMetS: EVs isolated from the serum of metabolic syndrome animals; MetS: metabolic syndrome.
Figure 8
Figure 8
RAS dysregulation induced by EVMetS in the N27 dopaminergic cell line and the C6 astrocytic cell line. The increase in the mRNA expression of the pro-inflammatory RAS components AGT (A,F), AT1 (B,G), and PRR (C,H) induced by EVMetS uptaking was inhibited when cells were treated with candesartan. The mRNA expression of the anti-inflammatory RAS components ACE2 (D,I) and MasR (E,J) was increased after candesartan treatment. For mRNA, the comparative cycle threshold values method (2−ΔΔCt) was used. Data are given as the mean ± SEM. * p < 0.05 compared to the control group; # p < 0.05 compared to the EVMetS group (one-way ANOVA with the Student-Newman-Keuls Method as a post hoc test (AD,F,HJ); Kruskal–Wallis one-way ANOVA with the Student-Newman-Keuls method (E) and Dunn’s method (G) as post hoc tests). ACE2: angiotensin-converting enzyme 2; AGT: angiotensinogen; AT1: angiotensin type 1 receptor; CAND: candesartan; EVs: extracellular vesicles; EVMetS: EVs isolated from the serum of metabolic syndrome animals; MasR: Mas-related receptor; MetS: metabolic syndrome; PRR: (pro)-renin receptor.

References

    1. Chakrabarti S., Bisaglia M. Oxidative Stress and Neuroinflammation in Parkinson’s Disease: The Role of Dopamine Oxidation Products. Antioxidants. 2023;12:955. doi: 10.3390/antiox12040955. - DOI - PMC - PubMed
    1. Hassanzadeh K., Rahimmi A. Oxidative stress and neuroinflammation in the story of Parkinson’s disease: Could targeting these pathways write a good ending? J. Cell Physiol. 2018;234:23–32. doi: 10.1002/jcp.26865. - DOI - PubMed
    1. Calabrese V., Santoro A., Monti D., Crupi R., Di Paola R., Latteri S., Cuzzocrea S., Zappia M., Giordano J., Calabrese E.J., et al. Aging and Parkinson’s Disease: Inflammaging, neuroinflammation and biological remodeling as key factors in pathogenesis. Free Radic. Biol. Med. 2018;115:80–91. doi: 10.1016/j.freeradbiomed.2017.10.379. - DOI - PubMed
    1. Kusters C.D.J., Paul K.C., Duarte Folle A., Keener A.M., Bronstein J.M., Bertram L., Hansen J., Horvath S., Sinsheimer J.S., Lill C.M., et al. Increased Menopausal Age Reduces the Risk of Parkinson’s Disease: A Mendelian Randomization Approach. Mov. Disord. 2021;36:2264–2272. doi: 10.1002/mds.28760. - DOI - PMC - PubMed
    1. Rocca W.A., Smith C.Y., Gazzuola Rocca L., Savica R., Mielke M.M. Association of Premenopausal Bilateral Oophorectomy With Parkinsonism and Parkinson Disease. JAMA Netw. Open. 2022;5:e2238663. doi: 10.1001/jamanetworkopen.2022.38663. - DOI - PMC - PubMed

LinkOut - more resources