. 2023 Nov 30;12(12):2061.
doi: 10.3390/antiox12122061.

The NADPH Oxidase Inhibitor, Mitoapocynin, Mitigates DFP-Induced Reactive Astrogliosis in a Rat Model of Organophosphate Neurotoxicity

Affiliations

The NADPH Oxidase Inhibitor, Mitoapocynin, Mitigates DFP-Induced Reactive Astrogliosis in a Rat Model of Organophosphate Neurotoxicity

Christina Meyer et al. Antioxidants (Basel). .

Abstract

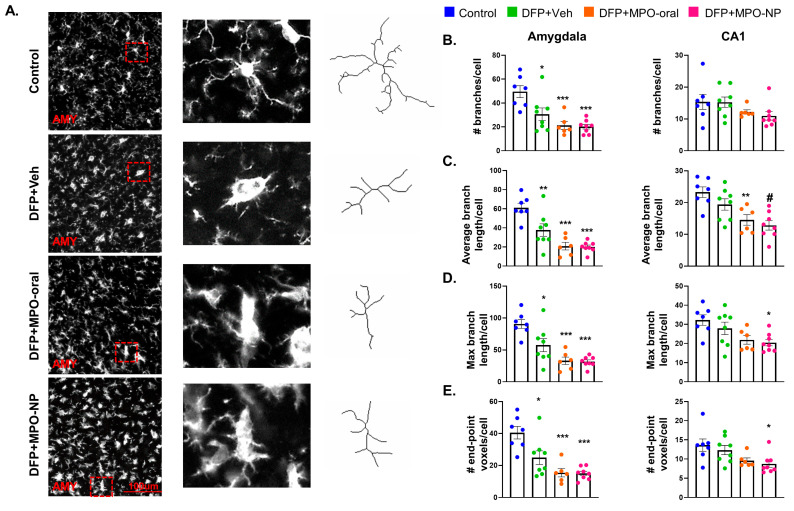
NADPH oxidase (NOX) is a primary mediator of superoxides, which promote oxidative stress, neurodegeneration, and neuroinflammation after diisopropylfluorophosphate (DFP) intoxication. Although orally administered mitoapocynin (MPO, 10 mg/kg), a mitochondrial-targeted NOX inhibitor, reduced oxidative stress and proinflammatory cytokines in the periphery, its efficacy in the brain regions of DFP-exposed rats was limited. In this study, we encapsulated MPO in polyanhydride nanoparticles (NPs) based on 1,6-bis(p-carboxyphenoxy) hexane (CPH) and sebacic anhydride (SA) for enhanced drug delivery to the brain and compared with a high oral dose of MPO (30 mg/kg). NOX2 (GP91phox) regulation and microglial (IBA1) morphology were analyzed to determine the efficacy of MPO-NP vs. MPO-oral in an 8-day study in the rat DFP model. Compared to the control, DFP-exposed animals exhibited significant upregulation of NOX2 and a reduced length and number of microglial processes, indicative of reactive microglia. Neither MPO treatment attenuated the DFP effect. Neurodegeneration (FJB+NeuN) was significantly greater in DFP-exposed groups regardless of treatment. Interestingly, neuronal loss in DFP+MPO-treated animals was not significantly different from the control. MPO-oral rescued inhibitory neuronal loss in the CA1 region of the hippocampus. Notably, MPO-NP and MPO-oral significantly reduced astrogliosis (absolute GFAP counts) and reactive gliosis (C3+GFAP). An analysis of inwardly rectifying potassium channels (Kir4.1) in astroglia revealed a significant reduction in the brain regions of the DFP+VEH group, but MPO had no effect. Overall, both NP-encapsulated and orally administered MPO had similar effects. Our findings demonstrate that MPO effectively mitigates DFP-induced reactive astrogliosis in several key brain regions and protects neurons in CA1, which may have long-term beneficial effects on spontaneous seizures and behavioral comorbidities. Long-term telemetry and behavioral studies and a different dosing regimen of MPO are required to understand its therapeutic potential.

Keywords: DFP (diisopropyl fluorophosphate); GP91phox; Kir4.1; NADPH oxidase (NOX); astrogliosis; nanoparticles; oxidative stress.


Conflict of interest statement

The authors declare no conflict of interest.

Figures

Figure 1
Figure 1
A schematic illustration of MPO-NP synthesis. CPH:SA and MPO were dissolved in methylene chloride, sonicated, and poured into a chilled pentane anti-solvent. MPO-NPs were collected by vacuum filtration and were scanned by an electron microscopy (SEM). Mean particle size was 415 ± 127 nm.
Figure 2
Figure 2
An experimental timeline of the dosing regimen and SE severity following DFP challenge. (A) MPO-NP animals were given three doses (4 mg, i.m.) every other day, beginning 2 h after DFP exposure i.e., 1 h post-MDZ. (B) DFP animals were treated with MPO (30 mg/kg, oral) or Vehicle (2% ethanol in dH2O, oral) received a daily dose until euthanized on day 8. (C) The seizure stage progression after DFP administration. Repeated measures two-way ANOVA. (D) The number of minutes spent in convulsive seizure (CS) in the 60 min following DFP. One-way ANOVA. n = 8, data are represented as mean ± SEM, * p < 0.05.
Figure 3
Figure 3
Serum and hippocampal MPO concentrations measured by LC/MS-MS. (A) MPO concentrations in DFP+MPO-NP (NPs 19.5% loaded) animals. Serum concentrations (pg/mL) decreased from 24 h to 48 h after the first dose, 48 h after the second dose, and on day 8 (72 h after the third dose). (B) MPO concentrations in DFP+MPO orally treated (30 mg/kg, daily) animals. Serum concentrations from 1 h to 6 h after the first dose. Hippocampal concentrations (pg/g) exceeded the serum on day 8 (24 h after the last dose). n = 4, data are represented as mean ± SEM. Chromatogram of MPO in the serum (C) and hippocampus (D) on day 8.
Figure 4
Figure 4
Neurodegeneration 8 days after DFP. (A) Representative IHC images of neurons (NeuN, red) in a degenerative state (FJB, green) in the CA1 region. Regional differences (B,C) and overall group effect on FJB-positive neurons. The colocalization was significantly greater in DFP+Veh animals in all regions quantified. FJB+NeuN was significantly reduced in the CA3 in DFP+MPO-NP. One-way ANOVA (B); two-way ANOVA mixed effects analysis (C). Regional differences (D,E) and overall group effect on absolute counts of NeuN-positive cells. Overall, there was a significant reduction in NeuN in DFP+Veh and DFP+MPO-NP, but not DFP+MPO-oral treated animals. One-way ANOVA (D); two-way ANOVA mixed effects analysis (E). n = 8, data are represented as mean ± SEM. * p < 0.05, ** p < 0.01, *** p < 0.001 compared to control. + p < 0.05 compared to DFP+MPO-oral.
Figure 5
Figure 5
Parvalbumin (PV) interneurons 8 days after DFP. (A) Representative IHC images of parvalbumin-positive neurons in the CA1 and piriform cortex (PC). (B) Parvalbumin-positive neurons were significantly decreased in DFP+Veh animals in the amygdala (AMY) and PC. In the CA1 region, MPO-oral significantly attenuated DFP-induced PV+ve interneuronal loss. One-way ANOVA. (C) A two-way ANOVA mixed effects analysis revealed a significant reduction in parvalbumin-positive cells in DFP+Veh and DFP+MPO-NP compared to control. n = 8, data are represented as mean ± SEM. * p < 0.05, ** p < 0.01 compared to control. # p < 0.05 compared to DFP+Veh.
Figure 6
Figure 6
GP91phox expression 8 days after DFP. (A) Representative IHC images of microglia (IBA1, red) and NOX2 (GP91phox, green) in the piriform cortex (PC). (B) GP91phox expression in microglia was significantly increased in DFP+Veh and DFP+MPO-NP in the CA1, CA3, dentate gyrus (DG), amygdala (AMY), and PC. DFP+MPO-oral only saw a significant increase in DG and PC. Kruskal–Wallis test (CA1, DG, AMY), one-way ANOVA (CA3, PC). (C) There was a significant group effect of all DFP groups. Two-way ANOVA mixed effects analysis. n = 8, data are represented as mean ± SEM. * p < 0.05, ** p < 0.01, *** p < 0.001 compared to the control.
Figure 7
Figure 7
Microglia morphology 8 days after DFP. (A) Representative images of the morphometric analysis in the amygdala (AMY). (BE) A comparison of the number of branches, average and maximum branch length, and the number of end-point voxels of microglia in the AMY and CA1 regions. Neither MPO-oral nor MPO-NP mitigated DFP-induced reactivity. One-way ANOVA. n = 8, data are represented as mean ± SEM. * p < 0.05, ** p < 0.01, *** p < 0.001 compared to control. # p < 0.05 compared to DFP+Veh.
Figure 8
Figure 8
Astrogliosis 8 days after DFP. (A) Representative IHC images of complement 3- positive (C3, green) astroglia (GFAP, red) in the amygdala (AMY). (B,C) C3, GFAP colocalization was significantly decreased in DFP+MPO-oral and DFP+MPO-NP in the CA1, CA3, dentate gyrus (DG), AMY, and piriform cortex (PC). (D,C) Absolute GFAP counts were significantly reduced in DFP animals treated with MPO-oral or MPO-NP compared to the Vehicle. One-way ANOVA (B,D); two-way ANOVA mixed effects analysis (C,E). n = 8, data are represented as mean ± SEM. * p < 0.05, ** p < 0.01, *** p < 0.001. *** p < 0.001 compared to control. # p < 0.05, ## p < 0.01, ### p < 0.001. #### p < 0.0001 compared to DFP+Veh.
Figure 9
Figure 9
Kir4.1 8 days after DFP. (A) Representative IHC images of inward rectifying potassium channel 4.1 (Kir4.1, white) and astroglia (GFAP, red) in the amygdala (AMY). One-way ANOVA (B) and two-way ANOVA mixed effect analysis (C) revealed a significant loss of Kir4.1 in response to DFP, regardless of treatment group. n = 8, data are represented as mean ± SEM. * p < 0.05, ** p < 0.01, *** p < 0.001. **** p < 0.0001 compared to control.

Similar articles

Cited by

References

    1. Lothman E.W., Bertman E.H., III Epileptogenic effects of status epilepticus. Epilepsia. 1993;34:S59–S70. doi: 10.1111/j.1528-1157.1993.tb05907.x. - DOI - PubMed
    1. Hesdorffer D.C., Logroscino G., Cascino G., Annegers J.F., Hauser W.A. Risk of unprovoked seizure after acute symptomatic seizure: Effect of status epilepticus. Ann. Neurol. Off. J. Am. Neurol. Assoc. Child Neurol. Soc. 1998;44:908–912. doi: 10.1002/ana.410440609. - DOI - PubMed
    1. Dudek F.E., Staley K.J. Jasper’s Basic Mechanisms of the Epilepsies. 4th ed. Oxford University Press; Oxford, UK: 2012. The time course and circuit mechanisms of acquired epileptogenesis. - PubMed
    1. Borowicz-Reutt K.K., Czuczwar S.J. Role of oxidative stress in epileptogenesis and potential implications for therapy. Pharmacol. Rep. 2020;72:1218–1226. doi: 10.1007/s43440-020-00143-w. - DOI - PMC - PubMed
    1. Zilberter Y., Popova I., Zilberter M. Unifying mechanism behind the onset of acquired epilepsy. Trends Pharmacol. Sci. 2022;43:87–96. doi: 10.1016/j.tips.2021.11.009. - DOI - PMC - PubMed