. 2023 Dec 9;15(24):5773.
doi: 10.3390/cancers15245773.

A Novel Metastatic Estrogen Receptor-Expressing Breast Cancer Model with Antiestrogen Responsiveness

Affiliations

A Novel Metastatic Estrogen Receptor-Expressing Breast Cancer Model with Antiestrogen Responsiveness

Kendall L Langsten et al. Cancers (Basel). .

Abstract

Most women diagnosed with breast cancer (BC) have estrogen receptor alpha-positive (ER+) disease. The current mouse models of ER+ BC often rely on exogenous estrogen to encourage metastasis, which modifies the immune system and the function of some tissues like bone. Other studies use genetically modified or immunocompromised mouse strains, which do not accurately replicate the clinical disease. To create a model of antiestrogen responsive BC with spontaneous metastasis, we developed a mouse model of 4T1.2 triple-negative (TN) breast cancer with virally transduced ER expression that metastasizes spontaneously without exogenous estrogen stimulation and is responsive to antiestrogen drugs. Our mouse model exhibited upregulated ER-responsive genes and multi-organ metastasis without exogenous estrogen administration. Additionally, we developed a second TN BC cell line, E0771/bone, to express ER, and while it expressed ER-responsive genes, it lacked spontaneous metastasis to clinically important tissues. Following antiestrogen treatment (tamoxifen, ICI 182,780, or vehicle control), 4T1.2- and E0771/bone-derived tumor volumes and weights were significantly decreased, exemplifying antiestrogen responsivity in both cell lines. This 4T1.2 tumor model, which expresses the estrogen receptor, metastasizes spontaneously, and responds to antiestrogen treatment, will allow for further investigation into the biology and potential treatment of metastasis.

Keywords: antiestrogen treatment; bone metastasis; estrogen receptor alpha; metastasis.


Conflict of interest statement

The authors declare no conflict of interest. The funders had no role in the design of the study; in the collection, analyses, or interpretation of data; in the writing of the manuscript, or in the decision to publish the results.

Figures

Figure 1
Figure 1
ER-expressing 4T1.2 cells had increased expression of genes and proteins associated with estrogen signaling compared with TN 4T1.2 cells. (A) ER-expressing and TN 4T1.2 BC cells were grown according to ATCC guidelines for 4T1 cells and RNA was collected when the cells reached 70% confluence. PCR was performed and the expression levels were normalized to the housekeeping gene Gapdh (Hprt and Tbp were also used for normalization with comparable results) and compared between ER-expressing and TN 4T1.2 cells. Of the 74 genes identified on the PCR array, 63 were upregulated in ER-expressing 4T1.2 cells compared with TN 4T1.2 cells. The upregulated genes are expressed as fold change of ER-expressing over TN. (B) There was more ER expression (red) in ER-expressing 4T1.2 cells (top) compared with TN 4T1.2 cells (bottom). DAPI was used as a nuclear stain (blue). Images were taken at 10×. (C) Immunohistochemistry blots with ER-expressing 4T1.2 and 4T1.2 cell lysate with 67NR (non-metastatic line isogenic to 4T1), 4T1.2 MCF7 (ER+ BC positive control), and LnCap-C42b, LnCap, and Rm1 (negative controls). The uncropped blots are shown in Figure S2.
Figure 2
Figure 2
While ER-expressing and TN 4T1.2 tumors grew at similar rates and had similar end weights, the size of the lung metastases was smaller in ER-expressing tumors. ER-expressing and TN 4T1.2 cells were injected into the 4th inguinal mammary fat pad in 25 mice per group. Tumors were measured every 2–3 days and tumor volume was calculated as length × width × width/2 for five weeks or until humane endpoints were met. Tumor growth is plotted as mean ± SEM with a logistic growth curve of best fit and the growth curves were not significantly different (p > 0.05). Final tumor weight was measured in grams and was not significantly different between the ER-expressing and TN 4T1.2 tumors (p > 0.05, Student’s t-test). Lung metastasis count via histologic analysis was not significantly different between TN 4T1.2 and ER-expressing 4T1.2 tumor-bearing mice (p > 0.05, Mann–Whitney test). Area of individual metastases in the lung was significantly smaller in the ER-expressing 4T1.2 tumor-bearing mice when compared with those bearing TN 4T1.2 tumors (p < 0.05, Mann–Whitney test); ns: no significance. * represents p < 0.05.
Figure 3
Figure 3
ER-expressing primary tumors have a modulated immune landscape compared with TN tumors. (A) Representative images of immunohistochemistry of primary TN and ER-expressing 4T1.2 tumors (images at 20×). (B) Quantification of tumors for CD68, CD3, CD4, CD8a, CD45r, and neutrophil elastase was performed using the VisioPharm pathology analysis software (Version 2018.4). The percentage of immunoreactive cells out of the total tumor area was determined with a custom-made app. Percentages of positive cells are represented as single values with the mean ± SEM for the ER-expressing and TN 4T1.2 tumors (n = 12–20). * represents p < 0.05 and ** represents p < 0.005 according to Mann–Whitney test, ns: no significance.
Figure 3
Figure 3
ER-expressing primary tumors have a modulated immune landscape compared with TN tumors. (A) Representative images of immunohistochemistry of primary TN and ER-expressing 4T1.2 tumors (images at 20×). (B) Quantification of tumors for CD68, CD3, CD4, CD8a, CD45r, and neutrophil elastase was performed using the VisioPharm pathology analysis software (Version 2018.4). The percentage of immunoreactive cells out of the total tumor area was determined with a custom-made app. Percentages of positive cells are represented as single values with the mean ± SEM for the ER-expressing and TN 4T1.2 tumors (n = 12–20). * represents p < 0.05 and ** represents p < 0.005 according to Mann–Whitney test, ns: no significance.
Figure 4
Figure 4
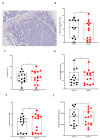
No histological evidence of bone changes was present in mice with ER-expressing or TN 4T1.2 tumors. Tibiae were isolated from mice after tumor implantation with ER-expressing or TN 4T1.2 BC cells. Bones were stained for TRAP+ osteoclasts (A; image at 5×) and bone histomorphometry was performed to calculate osteoclast surface per bone surface (B), osteoclast number (C), bone volume-to-tissue volume ratio (D), trabecular count per ROI (E), and trabecular thickness (F). Data are presented as mean percentage ± SEM (n = 7), p value was calculated using Mann–Whitney test and Student’s t-test with significance set at p < 0.05, ns: no significance.
Figure 5
Figure 5
ER-expressing tumors are responsive to antiestrogen treatment. ER-expressing and TN 4T1.2 BC cells were injected into the 4th inguinal mammary fat pad of Balb/c mice. Once the tumor volume reached 100 mm3, the mice were treated with vehicle control, 5 mg/60-day time-release pellet TAM, or 1 mg/wk ICI. Tumor volume was tracked over time and are presented as mean tumor volume ± SEM (n = 4–7). Tumor weight was measured upon experimental termination and are presented as mean tumor weight ± SEM (n = 4–7). * represents p < 0.05 and *** represents p < 0.005 according to two-way or one-way ANOVA.
Figure 6
Figure 6
Hind limb metastases were present in mice with ER+ 4T1.2 tumors regardless of antiestrogen treatment. Examples of immunohistochemistry of tibiae from mice (n = 48) for pan-cytokeratin. Only the ER-expressing 4T1.2 tumors metastasized to the bone, regardless of antiestrogen treatment. (A) Examples of TN 4T1.2 and ER-expressing 4T1.2 tumor pan-cytokeratin immunohistochemistry at the metaphysis are shown. Scale bar represents 150 µm. (B) Number of mice with metastatic lesions was quantified as the percentage of positive mice shown in the table for each cell type and treatment group. N.D.; not determined.
Figure 7
Figure 7
TAM induced alterations in the bone niche. Tibiae were isolated from mice after tumor implantation with ER-expressing or TN 4T1.2 BC cells and treatment with vehicle controls, 5 mg/60-day time-release pellet TAM, or 1 mg/wk ICI. Bones were stained for TRAP+ osteoclasts and bone histomorphometry was performed to calculate bone volume-to-tissue volume fraction or osteoclast surface over bone surface. A significant decrease in bone volume to tissue volume was measured in the mice with ER-expressing 4T1.2 tumors treated with ICI when compared with those treated with TAM. TAM treatment increased the bone volume-to-tissue volume ratio compared with other groups. Both are represented as mean percentage ± SEM (n = 4–8). ** represents p < 0.01 according to one-way ANOVA.

References

    1. Sung H., Ferlay J., Siegel R.L., Laversanne M., Soerjomataram I., Jemal A., Bray F. Global Cancer Statistics 2020: GLOBOCAN Estimates of Incidence and Mortality Worldwide for 36 Cancers in 185 Countries. CA Cancer J. Clin. 2021;71:209–249. doi: 10.3322/caac.21660. - DOI - PubMed
    1. Dieci M.V., Miglietta F., Guarneri V. Immune Infiltrates in Breast Cancer: Recent Updates and Clinical Implications. Cells. 2021;10:223. doi: 10.3390/cells10020223. - DOI - PMC - PubMed
    1. Holen I., Walker M., Nutter F., Fowles A., Evans C.A., Eaton C.L., Ottewell P.D. Oestrogen Receptor Positive Breast Cancer Metastasis to Bone: Inhibition by Targeting the Bone Microenvironment In Vivo. Clin. Exp. Metastasis. 2016;33:211–224. doi: 10.1007/s10585-015-9770-x. - DOI - PubMed
    1. Yoneda T., Williams P.J., Hiraga T., Niewolna M., Nishimura R. A Bone-Seeking Clone Exhibits Different Biological Properties from the MDA-MB-231 Parental Human Breast Cancer Cells and a Brain-Seeking Clone In Vivo and In Vitro. J. Bone Miner. Res. 2001;16:1486–1495. doi: 10.1359/jbmr.2001.16.8.1486. - DOI - PubMed
    1. Hiraga T., Ninomiya T. Establishment and Characterization of a C57BL/6 Mouse Model of Bone Metastasis of Breast Cancer. J. Bone Miner. Metab. 2019;37:235–242. doi: 10.1007/s00774-018-0927-y. - DOI - PubMed

LinkOut - more resources