

Increased Thyroidal Activity on Routine FDG-PET/CT after Combination Immune Checkpoint Inhibition: Temporal Associations with Clinical and Biochemical Thyroiditis
- PMID: 38136348
- PMCID: PMC10741830
- DOI: 10.3390/cancers15245803
Increased Thyroidal Activity on Routine FDG-PET/CT after Combination Immune Checkpoint Inhibition: Temporal Associations with Clinical and Biochemical Thyroiditis
Abstract
Background: FDG-PET/CT used for immune checkpoint inhibitor (ICI) response assessment can incidentally identify immune-related adverse events (irAEs), including thyroiditis. This study aimed to correlate the time course of FDG-PET/CT evidence of thyroiditis with clinical and biochemical evolution of thyroid dysfunction.
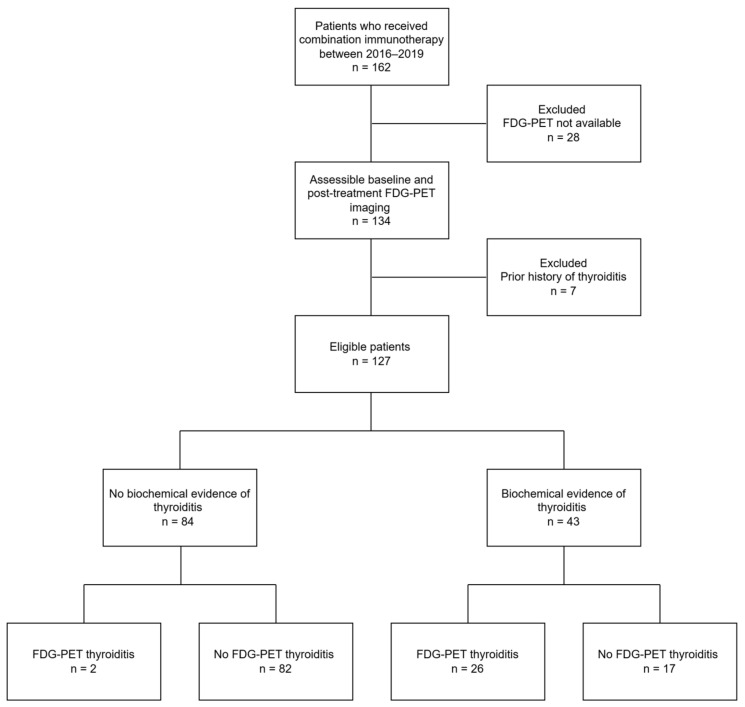
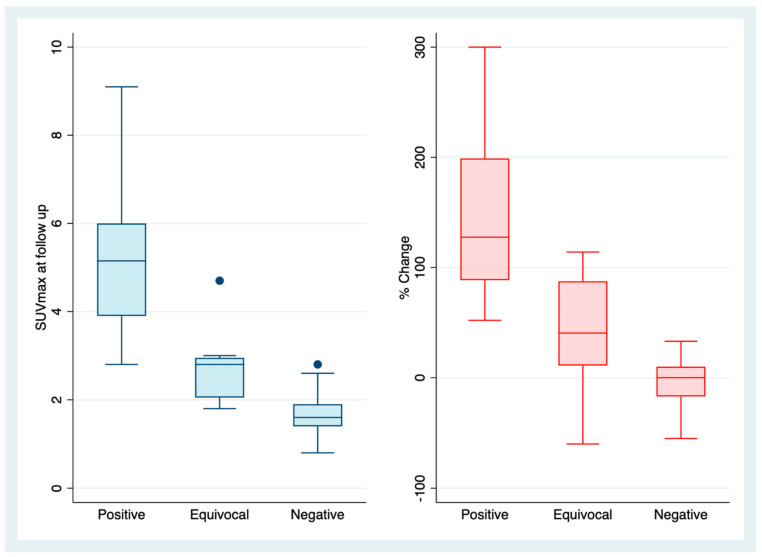
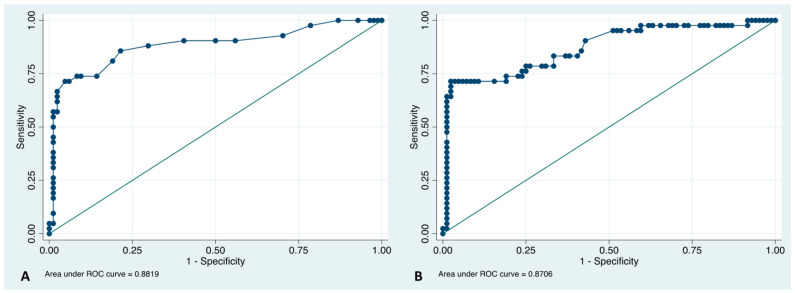
Methods: A retrospective review was performed by two independent blinded nuclear medicine physicians (NMPs) of thyroidal FDG uptake in 127 patients who underwent PET/CT between January 2016 and January 2019 at baseline and during treatment monitoring of combination ICI therapy for advanced melanoma. Interobserver agreement was assessed and FDG-PET/CT performance defined by a receiver-operating characteristic (ROC) curve using thyroid function tests (TFTs) as the standard of truth. Thyroid maximum standardized uptake value (SUVmax) and its temporal changes with respect to the longitudinal biochemistry were serially recorded.
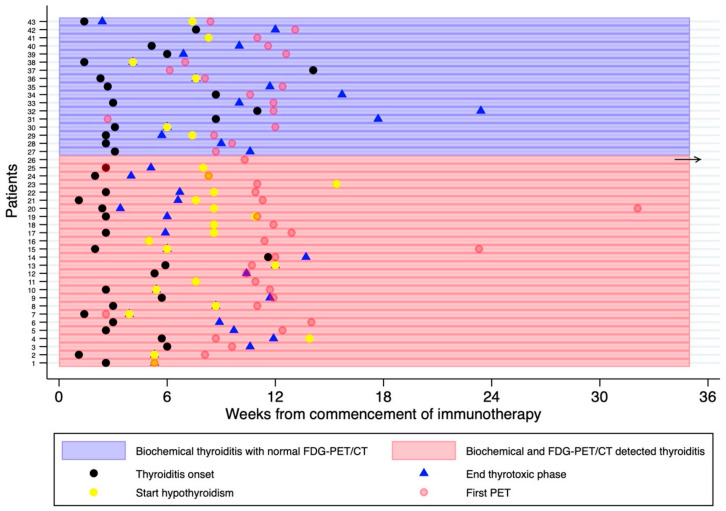
Results: At a median of 3 weeks after commencing ICI, 43/127 (34%) had a diagnosis of thyroiditis established by abnormal TFTs. FDG-PET/CT was performed at baseline and at a median of 11 weeks (range 3-32) following the start of therapy. ROC analysis showed an area under the curve of 0.87 (95% CI 0.80, 0.94) for FDG-PET/CT for detection of thyroiditis with a positive predictive value of 93%. Among patients with biochemical evidence of thyroiditis, those with a positive FDG-PET/CT were more likely to develop overt hypothyroidism (77% versus 35%, p < 0.01). In the evaluation of the index test, there was an almost perfect interobserver agreement between NMPs of 93.7% (95% CI 89.4-98.0), kappa 0.83.
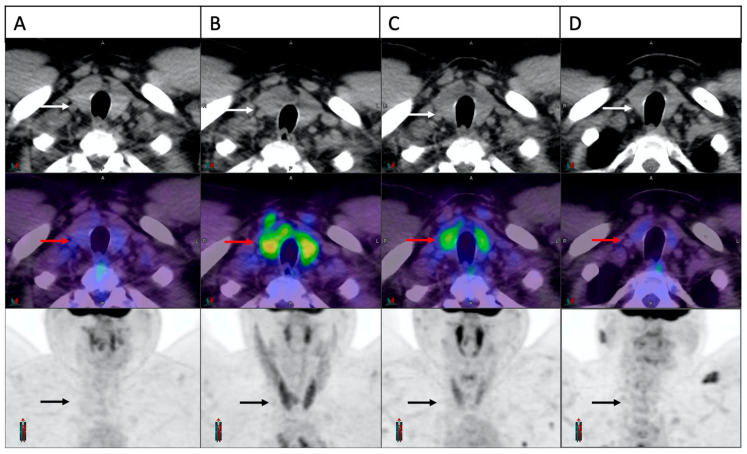
Conclusion: Increased metabolic activity of the thyroid on routine FDG-PET/CT performed for tumoral response of patients undergoing ICI therapy is generally detected well after routine biochemical diagnosis. Elevation of FDG uptake in the thyroid is predictive of overt clinical hypothyroidism and suggests that an ongoing robust inflammatory response beyond the initial thyrotoxic phase may be indicative of thyroid destruction.
Keywords: FDG-PET/CT; combination immunotherapy; endocrine toxicity; immune-related adverse event; interobserver agreement; ipilimumab and nivolumab; melanoma; thyroiditis.
Conflict of interest statement
The authors declare no conflict of interest.
Figures
References
-
- U.S. Food and Drug Administration FDA Approves Nivolumab plus Ipilimumab and Chemotherapy for First-Line Treatment of Metastatic NSCLC. Drug Approvals and Databases 2020. [(accessed on 4 July 2020)]; Available online: https://www.fda.gov/drugs/drug-approvals-and-databases/fda-approves-nivo....
-
- Wolchok J.D., Chiarion-Sileni V., Gonzalez R., Grob J.-J., Rutkowski P., Lao C.D., Cowey C.L., Schadendorf D., Wagstaff J., Dummer R., et al. CheckMate 067: 6.5-year outcomes in patients (pts) with advanced melanoma. J. Clin. Oncol. 2021;39((Suppl. 15)):9506. doi: 10.1200/JCO.2021.39.15_suppl.9506. - DOI
-
- Wolchok J.D., Chiarion-Sileni V., Gonzalez R., Grob J.-J., Rutkowski P., Lao C.D., Cowey C.L., Schadendorf D., Wagstaff J., Dummer R., et al. Long-Term Outcomes with Nivolumab Plus Ipilimumab or Nivolumab Alone Versus Ipilimumab in Patients with Advanced Melanoma. J. Clin. Oncol. 2022;40:127–137. doi: 10.1200/JCO.21.02229. - DOI - PMC - PubMed
LinkOut - more resources
Full Text Sources
