. 2023 Nov 21;13(12):1682.
doi: 10.3390/biom13121682.

The Blocking of Drug Resistance Channels by Selected Hydrophobic Statins in Chemoresistance Human Melanoma

Affiliations

The Blocking of Drug Resistance Channels by Selected Hydrophobic Statins in Chemoresistance Human Melanoma

Wojciech Placha et al. Biomolecules. .

Abstract

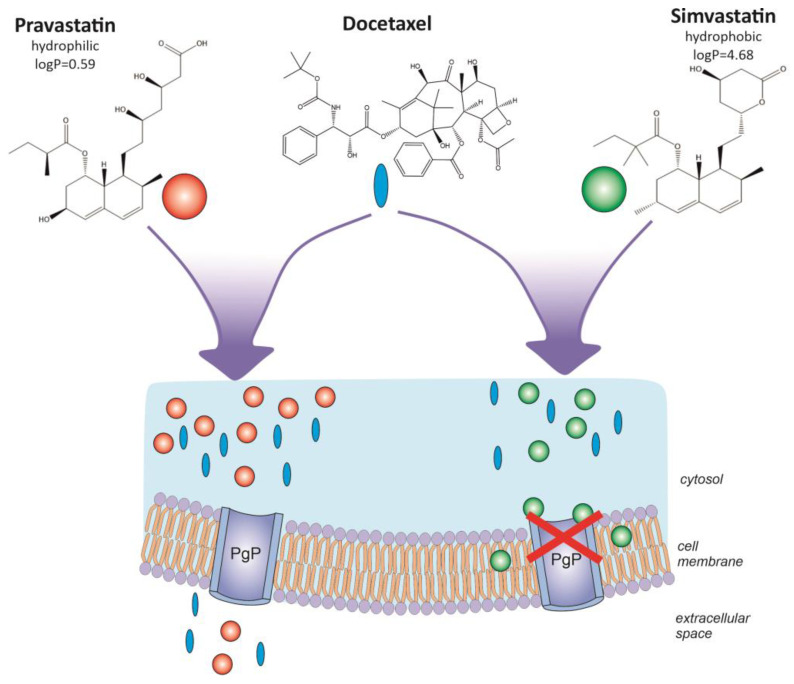
Despite the development of modern drugs, drug resistance in oncology remains the main factor limiting the curability of patients. This paper shows the use of a group of hydrophobic statins to inhibit drug resistance (Pgp protein). In a chemoresistance melanoma cell model, viability, necroptosis with DNA damage, the absorption of the applied pharmaceuticals, and the functional activity of the ABCB1 drug transporter after administration of docetaxel or docetaxel with a selected hydrophobic statin were studied. Taxol-resistant human melanoma cells from three stages of development were used as a model: both A375P and WM239A metastatic lines and radial growth phase WM35 cells. An animal model (Mus musculus SCID) was developed for the A375P cell line. The results show that hydrophobic statins administered with docetaxel increase the accumulation of the drug in the tumor cell a.o. by blocking the ABCB1 channel. They reduce taxol-induced drug resistance. The tumor size reduction was observed after the drug combination was administrated. It was shown that the structural similarity of statins is of secondary importance, e.g., pravastatin and simvastatin. Using cytostatics in the presence of hydrophobic statins increases their effectiveness while reducing their overall toxicity.

Keywords: docetaxel; glycoprotein P; hydrophobic statins; melanoma; multidrug resistance.


Conflict of interest statement

The authors declare no conflict of interest. The funders had no role in the design of the study; in the collection, analysis, or interpretation of the data; in the writing of the manuscript; or in the decision to publish the results.

Figures

Figure 1
Figure 1
Effect of selected statins administered with docetaxel on human melanoma. (A,B) MTT test result—cell viability of metastatic melanoma (chemoresistance) lines A375P and WM239A. The cell lines were cultured for 10 passages in sub-lethal doses of 1 nM docetaxel. After this time, cells of individual lines were detached from the substrate, counted, and plated on 96-well plates at 1.5 × 10³ per well. The cells were cultured for 48 h in the presence of drugs in appropriate compositions and concentrations. Control—10% FBS in RPMI, docetaxel—0.5 μM in medium (constant concentration), and statins (simvastatin, rosuvastatin, fluvastatin, pravastatin, and atorvastatin)—varying from 2.5–100 μM, docetaxel 0.5 μM (constant concentration) + appropriate statins, varying from 2.5–100 μM (six measurement points). The absorbance was measured in the range of 570 nm. There were 24 technical replications per measuring point. ANOVA tests were used for statistical analysis. Significant results are marked by asterisks.
Figure 2
Figure 2
(A) Effect of docetaxel and the combination of docetaxel with statins on the necroptosis of metastatic melanoma chemoresistance cells presented on a fluoresce image and a transmitted light image with use of the annexin and propidium iodide staining test. Chemoresistance cells were cultured on a microscope slide in small plates for 24 h, then stimulated with drugs at the above-mentioned concentrations (docetaxel 0.5 μM and statins 20 μM) for 24 h. The excitation wavelength for fluorescein (with annexin) is 488 nm, and the emission maximum is 518 nm. For propidium iodide: 488–540 nm and 617 nm, respectively. Cells not stimulated with the tested drugs were used as a negative control (melanoma cells cultured for 24 h). For example, white arrows indicate necroptosis, and blue arrows indicate necrosis. (B) Comparison of DNA damage in the comet assay test for melanoma cell lines (A375P and WM239A) in which statins were used together with taxol. The TM value (tail moment length) was used for the calculations. An average of 200 cells was used in the experiment. The results are the average of 11 independent repetitions. ANOVA and Tukey’s post hoc tests were used for statistical analysis. Significant results were marked by asterisks. Black asterisks indicate significance relative to Control, and green asterisks to T (docetaxel).
Figure 3
Figure 3
Determination of the level of reduced glutathione and oxidized glutathione in melanoma cell lines. The study was carried out on 3 human melanoma cell lines (A) A375P, (B) WM35 and (C) WM239A,. For each cell line, the level of GSH and GSSG was assessed in: cells not treated with the test compounds, cells treated with docetaxel 0.5 μM only, and cells treated with docetaxel 0.5 μM plus simvastatin, rosuvastatin, atorvastatin, pravastatin, and fluvastatin at a concentration of 20 μM. The preparation of samples for RP-HPLC analysis and the applied analysis took place using the RP-HPLC method. GSH—glutathione reduced; GSSG—glutathione oxidized. A—atorvastatin, F—fluvastatin, P—pravastatin, R—rosuvastatin, S—simvastatin, K—control, and T—docetaxel. The data represent the mean values with the standard deviation. The RP-HPLC technique was used, in 5 replicates. The limit of detection for GSH in the RP-HPLC method is equal to 0.01 [nmol·ml−1] and for GSSG 0.1 [nmol·mL−1]. The limit of quantification for GSH is equal to 0.1 [nmol·mL−1] and for GSSG—1 [nmol·mL−1].
Figure 4
Figure 4
Comparison of the effectiveness of the docetaxel/simvastatin drug composition by determining the effect on the kinetics of tumor growth on the A375P human melanoma cancer line. (A) The effectiveness of the composition of two pharmaceuticals, i.e., docetaxel and simvastatin, was tested compared to docetaxel alone. Experimental groups: mice (Mus musculus SCID) treated with docetaxel (monotherapy model) n = 15 in both experimental groups, in total n = 15 animals; mice treated with docetaxel and simvastatin (combination therapy model I) n = 15 in both experimental groups, total n = 15 animals; and saline-treated mice (control—no treatment) n = 10 in both experimental groups, total n = 10 animals. In total, 58 animals (males and females) were used for both research stages. The size of the above experimental groups was calculated using the following formula: n=1+2C(SDd)2, where: C = 10.51 (at α = 0.05 and β = 0.9), d—assumed minimum difference, and SD—standard deviation. Each animal was intravenously administered 100 µL of a solution of the therapeutic composition of docetaxel in saline at a concentration of 17 µM/kg body weight (BW) (group of n = 15, line A375P) or docetaxel/simvastatin at concentrations of 17 µM/kg BW and 50 mg/kg body weight, respectively (group n = 15, line A375P), and saline for the controls (group n = 10, line A375P). ANOVA and Tukey’s post hoc tests were used for statistical analysis. Example photos of melanoma tumors inoculated subcutaneously into SCID mice: (B) control mouse, (C) docetaxel-treated mouse, and (D) docetaxel- and statin-treated mouse.
Figure 5
Figure 5
Effect of docetaxel (T) administered with the appropriate statin in the A375P cell line on Pgp drug transporter activity, measured as ATP consumption. (A) A—atorvastatin, (B) F—fluvastatin, (C) R—rosuvastatin, and (D) S—simvastatin. The results are the average of 5 independent replications per 8 points. ANOVA and Tukey’s post hoc tests were used for statistical analysis. Significant results are marked by asterisks.
Figure 6
Figure 6
(A) The content of docetaxel (T) in human melanoma cells from three developmental stages for lines WM239A, A375P, and WM35. Docetaxel was administered to the cells with the appropriate statin: A—atorvastatin, F—fluvastatin, R—rosuvastatin, and S—simvastatin. The results are the average of 5 independent repetitions of 3 trials each. ANOVA and Tukey’s post hoc tests were used for statistical analysis. Significant results are marked by asterisks. (B) RP-HPLC result. (a) Example of the analysis of docetaxel uptake into A375P cells modulated with simvastatin (5 independent repetitions of 3 trials each). Peak no. 3 docetaxel; no. 6—simvastatin. (b) Mass spectrum of docetaxel. MW = 808.3534 corresponds to (C43H54O14N)1+ ion of the docetaxel molecule. There is a visible part in the insertion close-up view of the monoisotopic peak (error −0.65 ppm). The green bar thickness corresponds to a 1 ppm error. (c) Mass spectrum of simvastatin and simvastatin acid ions. Both molecules are visible in the sample, with them staying in equilibrium. Left insertion: simvastatin monoisotopic peak (error −0.07 ppm), right insertion: simvastatin acid monoisotopic peak (error −0.06 ppm). The green bars visible in both insertions represent a 0.2 ppm error.
Figure 7
Figure 7
Scheme of action of pravastatin (hydrophilic) and simvastatin (hydrophobic) in the presence of docetaxel.

References

    1. Pathania S., Bhatia R., Baldi A., Singh R., Rawal R.K. Drug Metabolizing Enzymes and Their Inhibitors’ Role in Cancer Resistance. Biomed. Pharmacother. 2018;105:53–65. doi: 10.1016/j.biopha.2018.05.117. - DOI - PubMed
    1. Ye Z., Lu Y., Wu T. The Impact of ATP-Binding Cassette Transporters on Metabolic Diseases. Nutr. Metab. 2020;17:61. doi: 10.1186/s12986-020-00478-4. - DOI - PMC - PubMed
    1. Locher K.P. Mechanistic Diversity in ATP-Binding Cassette (ABC) Transporters. Nat. Struct. Mol. Biol. 2016;23:487–493. doi: 10.1038/nsmb.3216. - DOI - PubMed
    1. Locher K.P. Structure and Mechanism of ATP-Binding Cassette Transporters. Philos. Trans. R. Soc. B Biol. Sci. 2009;364:239–245. doi: 10.1098/rstb.2008.0125. - DOI - PMC - PubMed
    1. ABCB1 ATP Binding Cassette Subfamily B Member 1 [Homo Sapiens (Human)]—Gene—NCBI. [(accessed on 23 January 2023)]; Available online: https://www.ncbi.nlm.nih.gov/gene/5243.

Publication types