. 2023 Dec 7;13(12):1758.
doi: 10.3390/biom13121758.

Melatonin as a Repairing Agent in Cadmium- and Free Fatty Acid-Induced Lipotoxicity

Affiliations

Melatonin as a Repairing Agent in Cadmium- and Free Fatty Acid-Induced Lipotoxicity

Anna Migni et al. Biomolecules. .

Abstract

(1) Background: Cadmium (Cd) is a potentially toxic element with a long half-life in the human body (20-40 years). Cytotoxicity mechanisms of Cd include increased levels of oxidative stress and apoptotic signaling, and recent studies have suggested that these aspects of Cd toxicity contribute a role in the pathobiology of non-alcoholic fatty liver disease (NAFLD), a highly prevalent ailment associated with hepatic lipotoxicity and an increased generation of reactive oxygen species (ROS). In this study, Cd toxicity and its interplay with fatty acid (FA)-induced lipotoxicity have been studied in intestinal epithelium and liver cells; the cytoprotective function of melatonin (MLT) has been also evaluated. (2) Methods: human liver cells (HepaRG), primary murine hepatocytes and Caco-2 intestinal epithelial cells were exposed to CdCl2 before and after induction of lipotoxicity with oleic acid (OA) and/or palmitic acid (PA), and in some experiments, FA was combined with MLT (50 nM) treatment. (3) Results: CdCl2 toxicity was associated with ROS induction and reduced cell viability in both the hepatic and intestinal cells. Cd and FA synergized to induce lipid droplet formation and ROS production; the latter was higher for PA compared to OA in liver cells, resulting in a higher reduction in cell viability, especially in HepaRG and primary hepatocytes, whereas CACO-2 cells showed higher resistance to Cd/PA-induced lipotoxicity compared to liver cells. MLT showed significant protection against Cd toxicity either considered alone or combined with FFA-induced lipotoxicity in primary liver cells. (4) Conclusions: Cd and PA combine their pro-oxidant activity to induce lipotoxicity in cellular populations of the gut-liver axis. MLT can be used to lessen the synergistic effect of Cd-PA on cellular ROS formation.

Keywords: cadmium; lipotoxicity; melatonin.


Conflict of interest statement

The authors declare no conflict of interest.

Figures

Figure 1
Figure 1
Experimental protocols (EP). The scheme shows the two-arm EP used in this study; namely, EP1 was designed to assess CdCl2 cytotoxicity effects as studied by the cell viability test and the activity of survival and stress MAPKs. EP2 was set to explore the hypothesis that Cd can interact with FFA in inducing lipotoxicity and ROS generation in liver and intestinal cells. In EP2, the cells were pre-treated with different concentrations of CdCl2 for 24 h and then treated for 48 h with 200 μM final concentration of the FFA oleic acid (OA) or palmitic acid (PA) or a combination of both (OA + PA). Effects of Cd and FFA were studied either in the presence or absence of the cytoprotective molecule MLT (50 nM) and against control experiments run with the vehicles of these treatments. Further details on experimental conditions are reported in the text.
Figure 2
Figure 2
Cell death levels in HepaRG (A) and CACO-2 (B) cells treated with CdCl2 and MLT. Apoptosis assay was studied by flow cytometry analysis after 48 h of treatment with different concentrations of CdCl2 (as shown in the chart) and 50 nM MLT using EP1 of Figure 1. Apoptosis and necrosis levels were determined by staining the cells by annexin V-FITC and propidium iodide (PI). Data were mean ± SD of three independent experiments. One-way ANOVA test: * p < 0,05; ** p < 0.001; *** p < 0.0001 (control vs. all treatments) and (CdCl2 vs. CdCl2 + MLT).
Figure 3
Figure 3
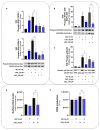
Protein kinase activity and redox parameters of HepaRG cells treated with CdCl2 and MLT. (A) MAPK-ERK1-2, (B) SAPK/JNK and (C) p38-MAPK activity was studied by immunoblot assessing phosphorylation and the native form of the proteins. (D) Cell-surface thiols and (E) cellular ROS were assessed by FACS-scan analysis. HepaRG cells were exposed for 3 h to CdCl2 (50 and 100 µM) and MLT (50 nM) that were studied as both separate treatments and in co-treatment mode (EP1). One-way ANOVA test: * p < 0.05; ** p < 0.01; *** p < 0.001 (control vs. all treatments). # p < 0.05; ## p < 0.01 (CdCl2 vs. CdCl2 + MLT).
Figure 4
Figure 4
Effect of CdCl2 and FFAs on cellular lipid accumulation in undifferentiated human liver HepaRG cells. Cell treatments were performed with the Experimental Protocol EP2 described in detail in Figure 1 and in the section “Methods”. Briefly, the cells were studied after a 24 h pre-treatment with CdCl2 and 48 h treatment with FFAs (200 µM final concentration each). (A) Hematoxylin and Oil Red O (ORO) were used to stain liver cells and lipid droplets, respectively (40× magnification). (B) Quantification of cellular lipids by spectrophotometric determination of ORO absorbance at 510 nm. The FFAs used for the treatments were oleic acid (OA), palmitic acid (PA) and their combination (OA + PA). One-way ANOVA test: * p < 0.05; ** p < 0.01; *** p < 0.001 (control test vs. all treatments); # p < 0.05; ## p < 0.01 (FFAs vs. all treatments).
Figure 5
Figure 5
Effect CdCl2, FFA and MLT on cellular lipids (AD) and cell viability levels of primary murine hepatocytes. Cellular lipids were assessed by ORO staining and spectrophotometric analysis at 510 nm of cellular extracts, as described in detail in the section “Materials and Methods”. (A) Lipids were assessed after 24 h pre-treatment with CdCl2 and 48 h treatment with different FFAs (200 µM final concentration each), namely, OA (B), PA (C) and OA + PA tested alone or in combination with the cytoprotective agent MLT (50 nM) (D). One-way ANOVA test: * p < 0.05; ** p < 0.01, *** p < 0.001 (control test vs. all treatments); # p < 0.05 (FFAs vs. FFAs/MLT). Cell viability was measured by MTT assay as described in detail in the section “Materials and Methods” (E). The cells were pre-treated for 24 h with increasing concentrations of CdCl2 and then treated with FFAs (200 µM each) for 48 h in the presence or absence of the cytoprotective agent MLT (50 nm) (E). One-way ANOVA test: * p < 0.05; ** p < 0.01 (CdCl2 + OA + PA vs. all treatments); # p < 0.05 (CdCl2 + OA + PA vs. CdCl2 + OA + PA + MLT).
Figure 6
Figure 6
Effect of CdCl2 and FFAs on the accumulation of cellular lipids in CACO-2 intestinal epithelial cells. Cell treatments were as described in the legend of Figure 7 (Experimental Protocol EP2, Figure 1). (A) Hematoxylin and Oil Red O (ORO) were used to stain liver cells and lipid droplets, respectively (40× magnification). (B) Quantification of cellular lipids by spectrophotometric determination of ORO absorbance at 510 nm. The FFAs used for the treatments were oleic acid (OA), palmitic acid (PA) and a combination of the two (OA + PA). One-way ANOVA test: ** p < 0.01; *** p < 0.001 (control test vs. all treatments). n.d. (non-detectable).
Figure 7
Figure 7
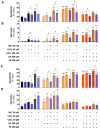
Effect of CdCl2, FFA and MLT on cell death levels of human liver HepaRG cells and CACO-2 intestinal epithelial cells. Apoptosis and necrosis levels were studied in HepaRG (A,B) and CACO-2 (C,D) cells exposed to different treatments, as described in EP2 (Figure 1). Apoptosis and necrosis were measured by FACS-scan using Annexin-V and Propidium Iodide probes as described in the methods section. One-way ANOVA test: * p < 0.05; ** p < 0.01; *** p < 0.001 (control vs. all treatments). # p < 0.05; (CdCl2 vs. all treatments); # p < 0.05 (CdCl2 and/or FFAs vs. CdCl2 and/or FFAs + MLT).
Figure 8
Figure 8
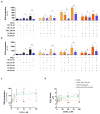
Cellular ROS levels in liver and intestinal cells treated with CdCl2, FFAs and the cytoprotective agent MLT. Cellular ROS were measured in HepaRG (A), CACO-2 (B) and primary murine hepatocytes (C); extracellular levels of H2O2 (D) were also determined in primary murine hepatocytes only. Cd, FFA and MLT treatments of HepaRG and CACO-2 cells were performed according to EP2 (Figure 1), whereas primary murine hepatocytes were pre-treated for 24 h with increasing concentrations of CdCl2 and then treated for 48 h with FFAs (200 µM final concentration each) in the presence or absence of the cytoprotective agent MLT (50 nm). One-way ANOVA test: (A,B) * p < 0.05; ** p < 0.01; *** p < 0.001 (control vs. all treatments). # p < 0.05 (CdCl2 vs. all treatments); # p < 0.05; ## p < 0.01 (CdCl2 and/or FFAs vs. CdCl2 and/or FFAs +MLT); (C,D) # p < 0.05; ## p < 0.01 (CdCl2 vs. CdCl2 + MLT and OA + PA vs. CdCl2 + OA + PA).
Figure 9
Figure 9
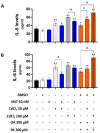
Levels of IL-6 in the culture medium of HepaRG cells (A) and primary murine hepatocytes (B) treated with CdCl2, FFAs and MLT. The experimental protocol for cell treatments was EP2 of Figure 1. IL-6 (pg/mL) levels were measured by ELISA method in cell culture media. Data were mean ± SD of 3 independent experiments. One way ANOVA test: * p < 0.05, ** p < 0.01 control (or DMSO) versus all treatments; # p < 0.05 CdCl2 versus CdCl2 + MLT or OA + PA versus CdCl2 + OA + PA.

Similar articles

Cited by

References

    1. Farag A.M., Nimick D.A., Kimball B.A., Church S.E., Harper D.D., Brumbaugh W.G. Concentrations of metals in water, sediment, biofilm, benthic macroinvertebrates, and fish in the Boulder River watershed, Montana, and the role of colloids in metal uptake. Arch. Environ. Contam. Toxicol. 2007;52:397–409. doi: 10.1007/s00244-005-0021-z. - DOI - PubMed
    1. Chaumont A., De Winter F., Dumont X., Haufroid V., Bernard A. The threshold level of urinary cadmium associated with increased urinary excretion of retinol-binding protein and β2-microglobulin: A re-assessment in a large cohort of nickel-cadmium battery workers. Occup. Environ. Med. 2011;68:257–264. doi: 10.1136/oem.2009.054122. - DOI - PMC - PubMed
    1. Moore W., Jr., Stara J.F., Crocker W.C., Malanchuk M., Iltis R. Comparison of 115m cadmium retention in rats following different routes of administration. Environ. Res. 1973;6:473–478. doi: 10.1016/0013-9351(73)90060-1. - DOI - PubMed
    1. Cannino G., Ferruggia E., Luparello C., Rinaldi A.M. Cadmium and mitochondria. Mitochondrion. 2009;9:377–384. doi: 10.1016/j.mito.2009.08.009. - DOI - PubMed
    1. Pizzino G., Bitto A., Interdonato M., Galfo F., Irrera N., Mecchio A., Pallio G., Ramistella V., De Luca F., Minutoli L., et al. Oxidative stress and DNA repair and detoxification gene expression in adolescents exposed to heavy metals living in the Milazzo-Valle del Mela area (Sicily, Italy) Redox Biol. 2014;2:686–693. doi: 10.1016/j.redox.2014.05.003. - DOI - PMC - PubMed

Publication types