. 2023 Dec 11;13(12):1774.
doi: 10.3390/biom13121774.

YidC from Escherichia coli Forms an Ion-Conducting Pore upon Activation by Ribosomes

Affiliations

YidC from Escherichia coli Forms an Ion-Conducting Pore upon Activation by Ribosomes

Denis G Knyazev et al. Biomolecules. .

Abstract

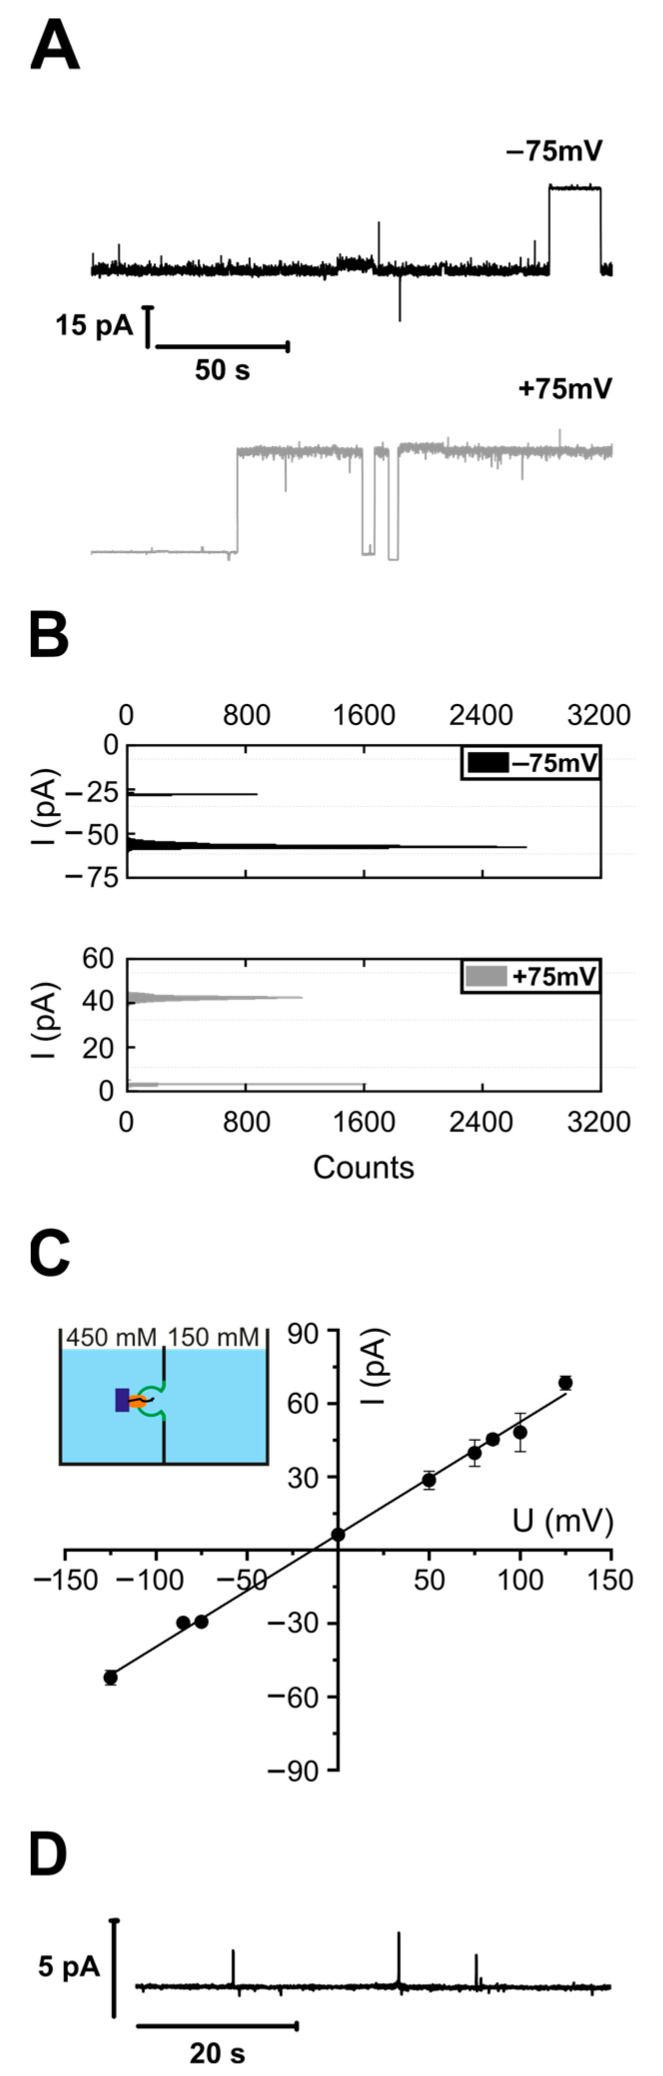
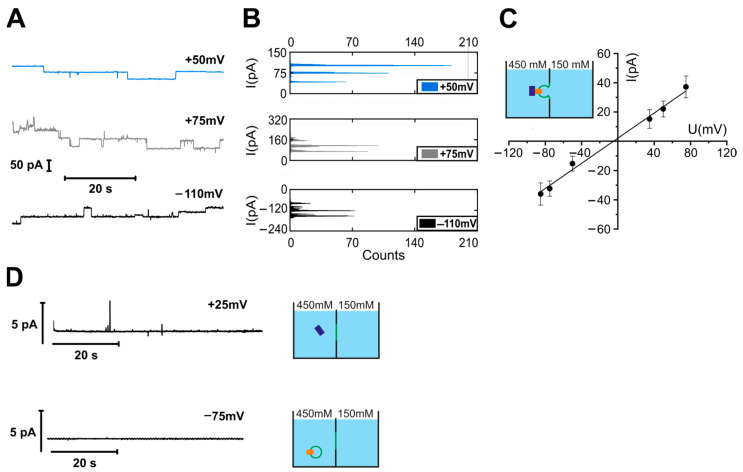
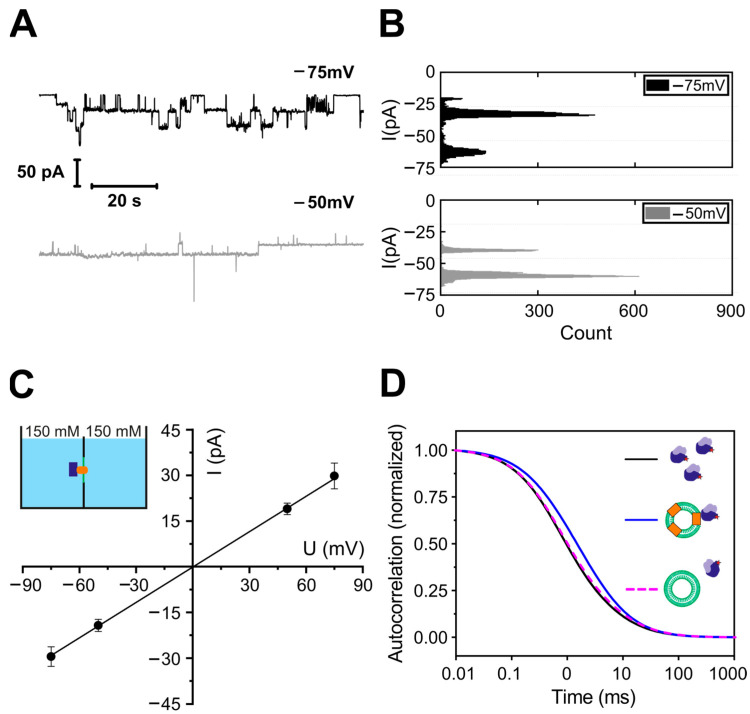
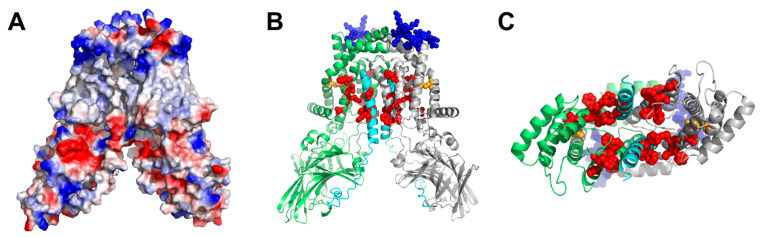
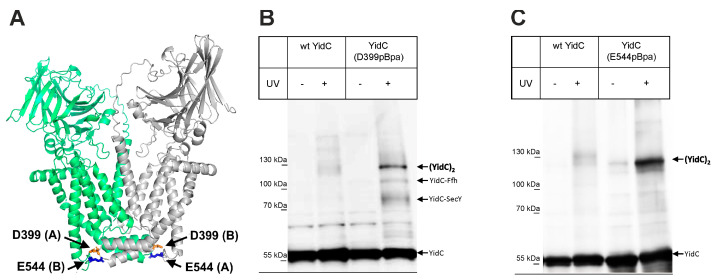
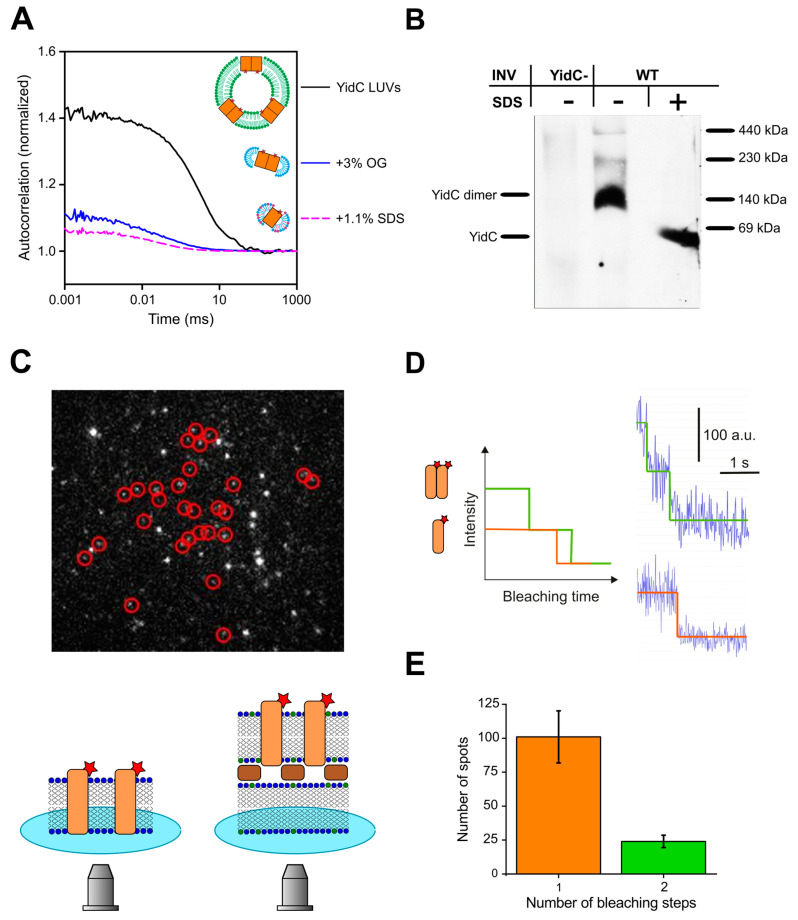
The universally conserved protein YidC aids in the insertion and folding of transmembrane polypeptides. Supposedly, a charged arginine faces its hydrophobic lipid core, facilitating polypeptide sliding along YidC's surface. How the membrane barrier to other molecules may be maintained is unclear. Here, we show that the purified and reconstituted E. coli YidC forms an ion-conducting transmembrane pore upon ribosome or ribosome-nascent chain complex (RNC) binding. In contrast to monomeric YidC structures, an AlphaFold parallel YidC dimer model harbors a pore. Experimental evidence for a dimeric assembly comes from our BN-PAGE analysis of native vesicles, fluorescence correlation spectroscopy studies, single-molecule fluorescence photobleaching observations, and crosslinking experiments. In the dimeric model, the conserved arginine and other residues interacting with nascent chains point into the putative pore. This result suggests the possibility of a YidC-assisted insertion mode alternative to the insertase mechanism.

Keywords: electrophysiology; fluorescence correlation spectroscopy; protein translocation; single dye tracing.


Conflict of interest statement

The authors declare no conflict of interest.

Figures

Figure 1
Figure 1
YidC exhibits channel activity after FoC-RNC binding. (A) Current traces show single channel openings and closings recorded at different voltages. The YidC-RNC complex was reconstituted into the planar bilayer via a vesicle fusion assay conducted in asymmetric salt conditions: 450 mM KCl in the cis compartment, 150 mM KCl in the trans compartment, and 50 mM K-HEPES, pH 7.5, in both compartments. YidC proteoliposomes were added to the chamber with a pre-formed lipid bilayer from the hypertonic side. The open states are noisier than the closed states due to the frequent flickering of the pore. (B) Current histograms corresponding to each trace in (A). The distance between each of the two neighbor peaks on the histogram corresponds to the current through a single channel. (C) The current–voltage plot of the YidC-RNC complex was obtained from single channel amplitudes at different voltages (dots) from traces, like in (B). The linear fit yielded the single channel conductivity g = 459 ± 20 pS and a reversal potential of −9 mV resulting from the slight asymmetry in the conductance for cations and anions. A colored scheme shows the chamber, with two compartments filled with solutions of the indicated ionic strength. The compartments are separated by the lipid bilayer (green), containing YidC (orange) and bound RNC (ribosome as a purple rectangle with a nascent chain as a black line). (D) Negative control: lack of channel activity in the absence of FoC-RNC. At least three biological replicates were used for electrophysiological measurements.
Figure 2
Figure 2
YidC exhibits channel activity after ribosome binding. (A) Current traces show single channel openings and closings recorded at different voltages. (B) Current histograms corresponding to each trace in (A). The distance between each of the two neighbor peaks on the histogram corresponds to the current through a single channel. (C) The current–voltage plot of the YidC–ribosome complex was obtained from single channel amplitudes at different voltages (dots) from traces, like in (B). The linear fit yielded the single channel conductivity g = 436 ± 20 pS. The reversal potential of −5 mV indicates the lower asymmetry for cations and anions’ permeabilities, compared to Figure 1. The YidC–ribosome complex was reconstituted into the planar bilayer by vesicle fusion, as in Figure 1. (D) Negative controls: lack of channel activity without ribosomes (lower trace) or YidC (upper trace).
Figure 3
Figure 3
Ribosomes activate YidCΔC. (A) Channel activity of the planar bilayers with the reconstituted YidCΔC after adding ribosomes. The experiments are analogous to the ones in Figure S1. (B) Histograms of the recordings shown in (A). (C) Single channel amplitudes (dots) and the current–voltage characteristic of the YidCΔC–ribosome complex (line) at different voltages obtained from traces, like in (A). Single channel conductivity g = 392 ± 30 pS. (D) The binding of ribosomes to YidCΔC vesicles observed via fluorescence correlation spectroscopy. Autocorrelation curves of labeled ribosomes in solution (black), of ribosomes mixed with YidCΔC proteoliposomes (blue), and ribosomes mixed with empty vesicles containing a lipid label (pink dashed line). The ribosomes and vesicles have comparable diffusion times across the confocal volume, whereas their complex diffuses slower. No binding could be observed when ribosomes were mixed with empty vesicles. Experiments were conducted in 150 mM KCl and 50 mM K-HEPES, pH 7.5. At least three biological replicates were used for the FCS measurements.
Figure 4
Figure 4
Model of the YidC dimer created with AlphaFold. (A) Surface charge representation of the parallel dimer model. The two closely interacting alpha-helical domains form a consistent hydrophobic belt. Color code: blue—positive charge, red—negative charge, white—no charge. (B) Cartoon representation of the parallel dimer model (top: cytosol, bottom: periplasm). The C-terminal amino acids (blue spheres) are exposed and thus available for potential interaction with a ribosome. The highly flexible N-terminus (cyan) was modeled to participate in the parallel helix formation and might contribute to the hydrophobic belt and substrate translocation or gating. Amino acids previously described as involved in substrate interactions are highlighted with red [69] and orange (R366) [16] spheres, respectively. (C) Model viewed from below and with the beta domains removed. Notably, most of the amino acids described as potential interactors with YidC substrates are grouped in the center of the parallel complex, many of them even facing the inside. The model was analyzed and visualized with PyMOL.
Figure 5
Figure 5
The C1 loop and the C-terminus of YidC are involved in YidC dimerization. (A) Location of residues D399 within the C1 loop and E544 at the C-termini in the parallel YidC dimer model, which were replaced by para-benzoyl-L-phenylalanine (pBpa). (B) In vivo photo-crosslinking performed with E. coli BL21 cells expressing yidC from the plasmid PlacsecYEG-yidC. WT refers to wild-type YidC and D399pBpa to a YidC variant with pBpa inserted at position 399. After UV exposure on ice and cell breakage, YidC and its crosslinked partner proteins were separated by SDS-PAGE and, after western transfer, decorated with α-YidC antibodies. A sample without UV exposure served as a control. The crosslinks are indicated and have previously been confirmed via mass spectrometry [12]. (C) As in B, pBpa was inserted at position 544 within the C-terminus of YidC. YidC and its crosslinked dimer are indicated. The crosslink experiments were performed several times (n ≥ 3) as biological replicates, and a representative gel is shown.
Figure 6
Figure 6
Stoichiometry of YidC. (A) FCS served to obtain the YidC stoichiometry in reconstituted liposomes. The number per confocal volume of YidC vesicles, YidC-OG-lipid, and YidC-OG-lipid-SDS micelles was derived from the amplitude A of the corresponding autocorrelation curve as 1/(A − 1). In the same order, the number of resulting particles amounted to about 2.5, 7.5, and 15, respectively, meaning that the vesicles contained, on average, three YidC dimers. The color code for cartoon schemes is the same as in Figure 3, with OG molecules depicted in cyan and SDS molecules in dark red. The red stars indicate the fluorescent label. (B) YidC forms dimers in its native environment. INVs of wild-type E. coli cells (wt) or a conditional YidC depletion strain (YidC-) were analyzed by BN-PAGE and, in the course of Western blotting, decorated with an antibody against YidC. The BN page clearly shows a YidC dimer at 140 kDa (lane 2), which can be dissolved to a monomeric state via SDS treatment before loading the BN-PAGE (lane 3). (C) An exemplary single molecule fluorescence bleaching experiment. Such experiments were conducted on supported (lower scheme on the left) and suspended (lower scheme on the right) lipid bilayers, which were formed from YidC vesicles mixed with empty vesicles (1:1000). The color code of the schemes is the same as above, with streptavidin crystal shown as brown rectangles, biotinylated lipid shown in green, and cover slide glass in blue. The spots marked by red circles were later analyzed. The brighter spots correspond to aggregates. (D) Spots in the red circles showed one- and two-step bleaching as schematically shown on the left, with exemplary intensity traces on the right. (E) The histogram of the number of bleaching steps generated after analyzing the spots from different experiments shows that 101 spots were bleached in one step and 24 in two steps. That is, approx. 1/5 of the spots corresponded to YidC dimers. At least three biological replicates were used in each experimental approach.

Similar articles

Cited by

References

    1. Vogtle F.N., Koch H.G., Meisinger C. A common evolutionary origin reveals fundamental principles of protein insertases. PLoS Biol. 2022;20:e3001558. doi: 10.1371/journal.pbio.3001558. - DOI - PMC - PubMed
    1. Samuelson J.C., Jiang F., Yi L., Chen M., de Gier J.W., Kuhn A., Dalbey R.E. Function of YidC for the insertion of M13 procoat protein in Escherichia coli: Translocation of mutants that show differences in their membrane potential dependence and Sec requirement. J. Biol. Chem. 2001;276:34847–34852. doi: 10.1074/jbc.M105793200. - DOI - PubMed
    1. Yi L., Jiang F., Chen M., Cain B., Bolhuis A., Dalbey R.E. YidC Is Strictly Required for Membrane Insertion of Subunits a and c of the F1F0ATP Synthase and SecE of the SecYEG Translocase. Biochemistry. 2003;42:10537–10544. doi: 10.1021/bi034309h. - DOI - PubMed
    1. Welte T., Kudva R., Kuhn P., Sturm L., Braig D., Muller M., Warscheid B., Drepper F., Koch H.G. Promiscuous targeting of polytopic membrane proteins to SecYEG or YidC by the Escherichia coli signal recognition particle. Mol. Biol. Cell. 2012;23:464–479. doi: 10.1091/mbc.e11-07-0590. - DOI - PMC - PubMed
    1. Scotti P.A., Urbanus M.L., Brunner J., de Gier J.W., von Heijne G., van der Does C., Driessen A.J.M., Oudega B., Luirink J. YidC, the Escherichia coli homologue of mitochondrial Oxa1p, is a component of the Sec translocase. EMBO J. 2000;19:542–549. doi: 10.1093/emboj/19.4.542. - DOI - PMC - PubMed

Publication types

MeSH terms

LinkOut - more resources