. 2023 Nov 30;14(12):2163.
doi: 10.3390/genes14122163.

RNA-Sequencing Analysis Reveals the Role of Mitochondrial Energy Metabolism Alterations and Immune Cell Activation in Form-Deprivation and Lens-Induced Myopia in Mice

Affiliations

RNA-Sequencing Analysis Reveals the Role of Mitochondrial Energy Metabolism Alterations and Immune Cell Activation in Form-Deprivation and Lens-Induced Myopia in Mice

Hojung Kim et al. Genes (Basel). .

Abstract

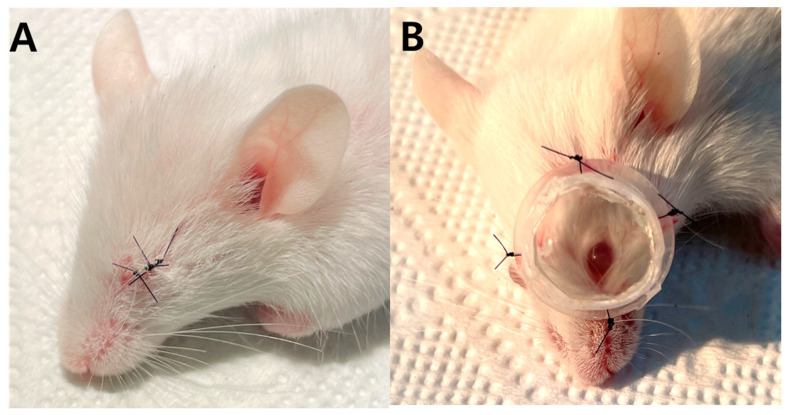
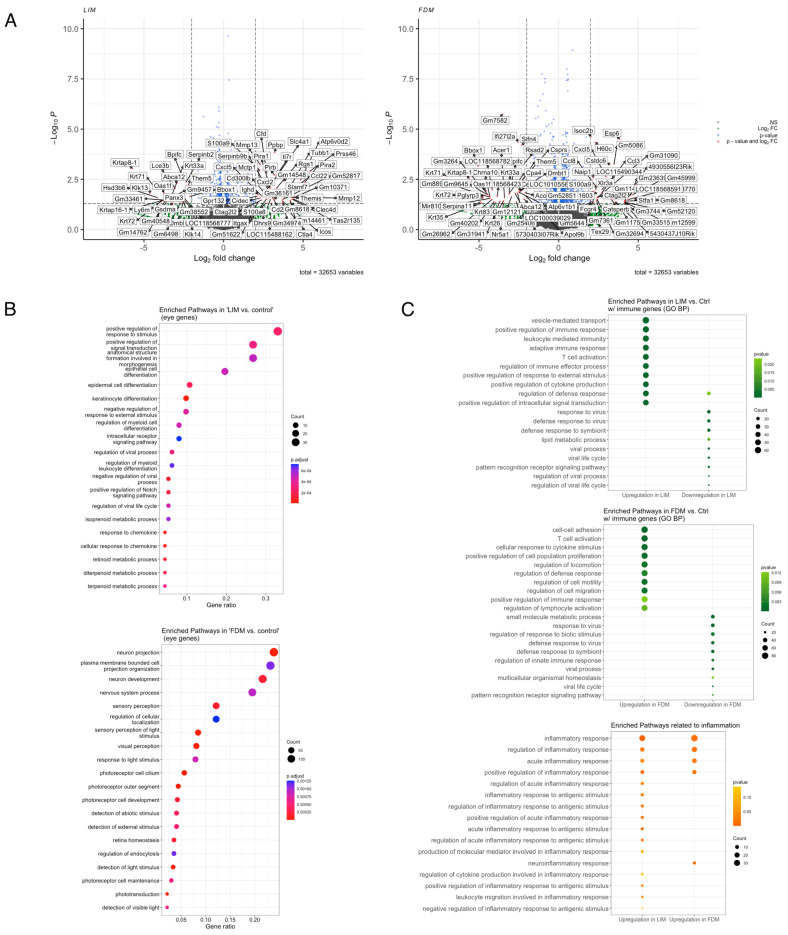
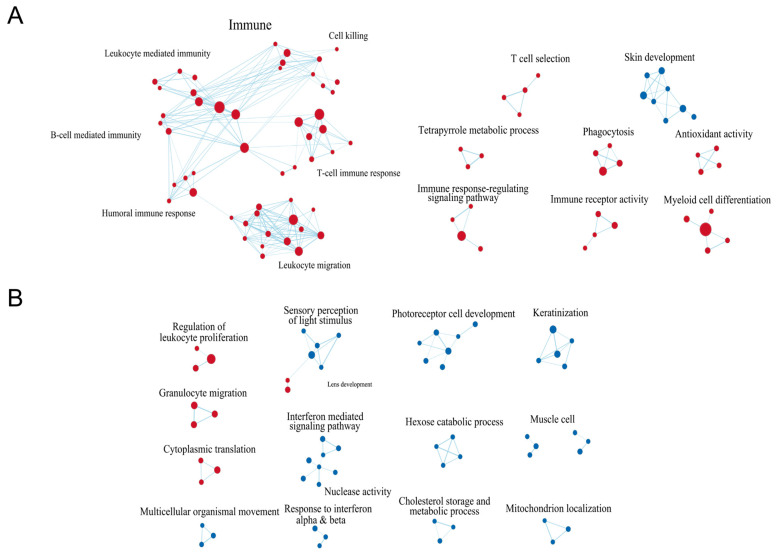
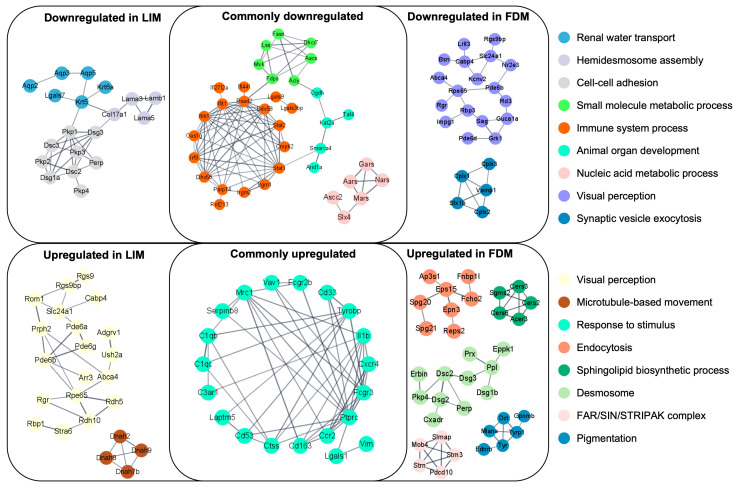
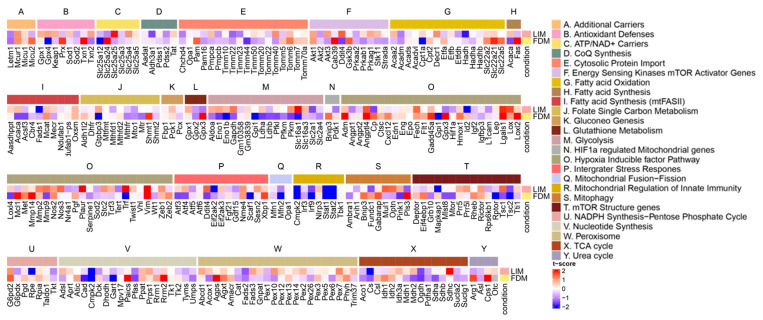
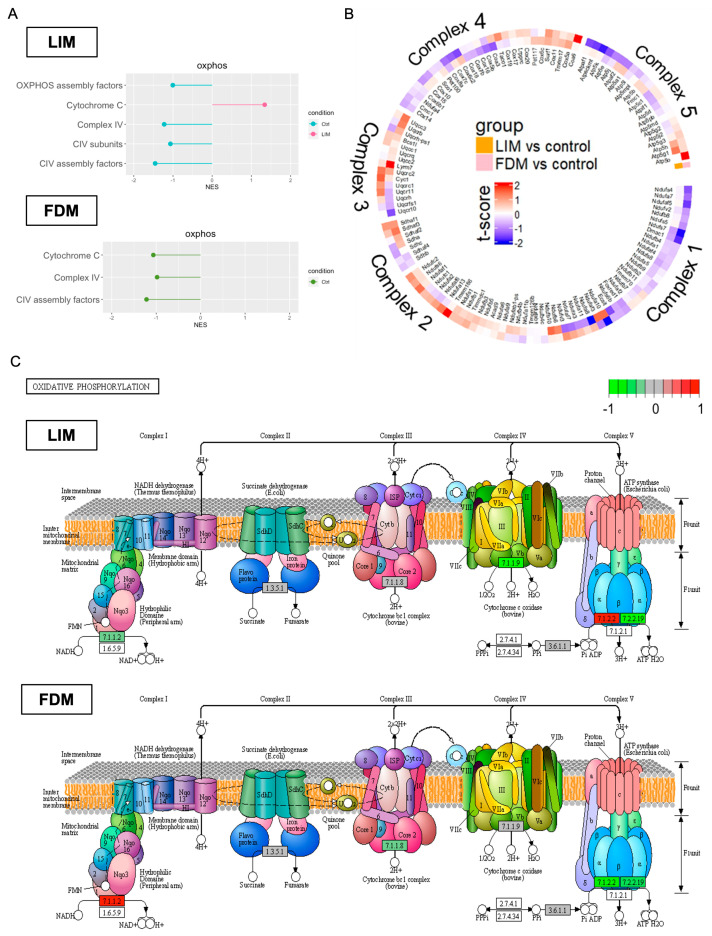
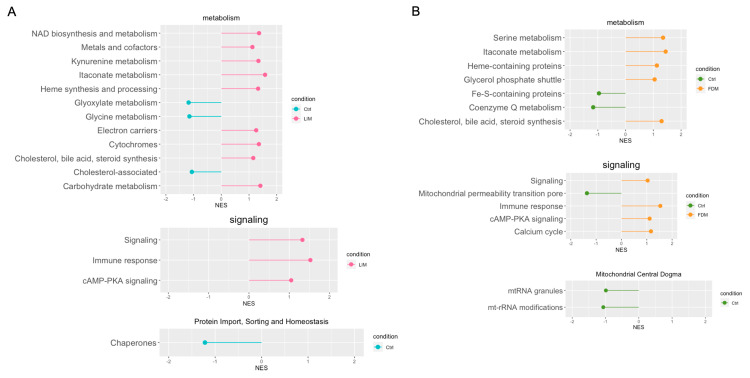
Myopia is a substantial global public health concern primarily linked to the elongation of the axial length of the eyeball. While numerous animal models have been employed to investigate myopia, the specific contributions of genetic factors and the intricate signaling pathways involved remain incompletely understood. In this study, we conducted RNA-seq analysis to explore genes and pathways in two distinct myopia-inducing mouse models: form-deprivation myopia (FDM) and lens-induced myopia (LIM). Comparative analysis with a control group revealed significant differential expression of 2362 genes in FDM and 503 genes in LIM. Gene Set Enrichment Analysis (GSEA) identified a common immune-associated pathway between LIM and FDM, with LIM exhibiting more extensive interactions. Notably, downregulation was observed in OxPhos complex III of FDM and complex IV of LIM. Subunit A of complex I was downregulated in LIM but upregulated in FDM. Additionally, complex V was upregulated in LIM but downregulated in FDM. These findings suggest a connection between alterations in energy metabolism and immune cell activation, shedding light on a novel avenue for understanding myopia's pathophysiology. Our research underscores the necessity for a comprehensive approach to comprehending myopia development, which integrates insights from energy metabolism, oxidative stress, and immune response pathways.

Keywords: RNA sequencing; animal model; mice; myopia.


Conflict of interest statement

The authors declare no conflict of interest.

Figures

Figure 1
Figure 1
Form-deprivation myopia (A) and lens-induced myopia (B) in mice.
Figure 2
Figure 2
Differentially expressed genes and enriched pathways. (A) Differentially expressed genes in LIM and FDM groups compared to the control group (p-value < 0.05 and log2 fold-change > 2). (B) Top 20 most enriched pathways of known eye-associated genes from MSigDB in LIM and FDM compared with the control (p-value < 0.1 and q-value < 0.25). (C) Top 10 most enriched pathways directly associated with immune and inflammation in LIM and FDM compared with the control (p-value < 0.1 and q-value < 0.25).
Figure 3
Figure 3
GSEA-based network visualization in LIM and FDM groups compared to the control group. (A) Network association of LIM compared with the control. (B) Network association of FDM compared with the control. Edges are inferred by considering strong correlation between signaling pathways and each node (as enriched pathway) size corresponds with number of edges. The color is proportional to degree of differentiation, where up/downregulation indicates red or blue, respectively. The selected pathways were filtered using false discovery rate (FDR) < 0.75 and edge similarities > 0.375.
Figure 4
Figure 4
Protein–Protein Interaction (PPI) networks based on differentially expressed genes (DEGs) in LIM and FDM groups compared to the control group. Each node represents a protein mapped to one of the DEGs, and the edges represent strong interactions between corresponding proteins. DEGs were selected through p-values of 0.2 for LIM and 0.1 for FDM. Interactions with protein interaction scores higher than 0.9 were included into clusters where each cluster contained at least five proteins.
Figure 5
Figure 5
Heatmap of pathways associated with mitochondrial energy metabolism. Transcriptional profile alterations (as t-scores) of the customized mitochondria-associated gene set obtained from [26] were visualized. Red indicates upregulation in either the LIM or FDM compared to the control, whereas blue indicates downregulation in either the LIM or FDM compared to the control.
Figure 6
Figure 6
Multiple comparative analyses of Oxidative Phosphorylation (OxPhos) in LIM and FDM in comparison to the control group. (A) Up/Downregulation of OxPhos-associated pathways through GSEA (fgsea). Common gene lists between DEGs (p-value < 0.5) and MitoCarta 3.0 were used. (B) Transcriptional profile alteration of OxPhos with t-score. (C) OxPhos complex-specific gene expression changes using Pathview [27]. All the genes used for the three different analyses were DEGs with p-value < 0.5.
Figure 7
Figure 7
Lollipop based on GSEA with fgsea using MitoCarta3.0 in LIM and FDM groups compared to the control group. (A) Enriched pathways in LIM on metabolism/signaling/protein import, sorting and homeostasis. (B) Enriched pathways in FDM on metabolism/signaling/mitochondrial central dogma. Common gene lists between DEGs (p-value < 0.5) and MitoCarta 3.0 were used.

Similar articles

References

    1. Morgan I.G., Ohno-Matsui K., Saw S.-M. Myopia. Lancet. 2012;379:1739–1748. doi: 10.1016/S0140-6736(12)60272-4. - DOI - PubMed
    1. Verkicharla P.K., Ohno-Matsui K., Saw S.M. Current and Predicted Demographics of High Myopia and an Update of Its Associated Pathological Changes. Ophthalmic Physiol. Opt. 2015;35:465–475. doi: 10.1111/opo.12238. - DOI - PubMed
    1. Morgan I.G., He M., Rose K.A. Epidemic of Pathologic Myopia: What Can Laboratory Studies and Epidemiology Tell Us? Retina. 2017;37:989–997. doi: 10.1097/IAE.0000000000001272. - DOI - PubMed
    1. Schaeffel F., Feldkaemper M. Animal Models in Myopia Research. Clin. Exp. Optom. 2015;98:507–517. doi: 10.1111/cxo.12312. - DOI - PubMed
    1. Ashby R. Animal Studies and the Mechanism of Myopia-Protection by Light? Optom. Vis. Sci. 2016;93:1052–1054. doi: 10.1097/OPX.0000000000000978. - DOI - PubMed

Publication types

LinkOut - more resources