. 2023 Dec 1;14(12):2169.
doi: 10.3390/genes14122169.

Computational Characterization of Undifferentially Expressed Genes with Altered Transcription Regulation in Lung Cancer

Affiliations

Computational Characterization of Undifferentially Expressed Genes with Altered Transcription Regulation in Lung Cancer

Ruihao Xin et al. Genes (Basel). .

Abstract

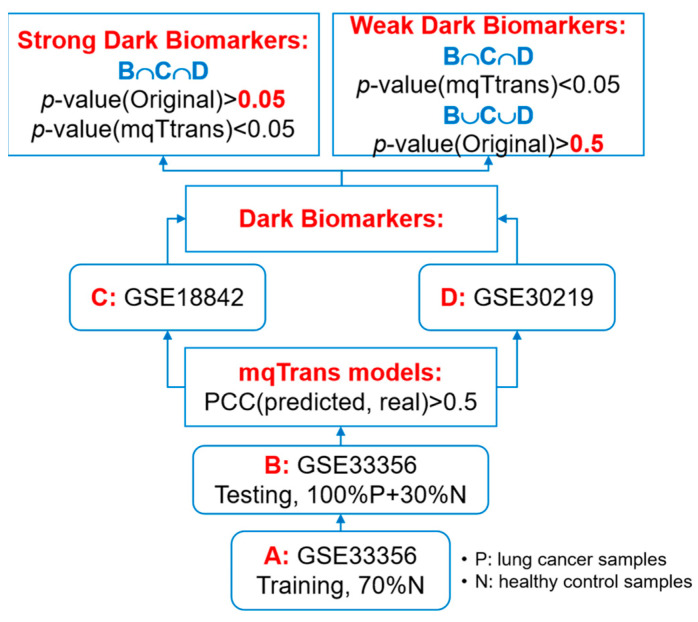
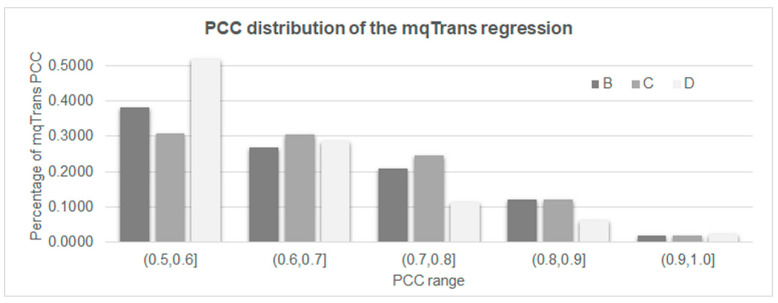
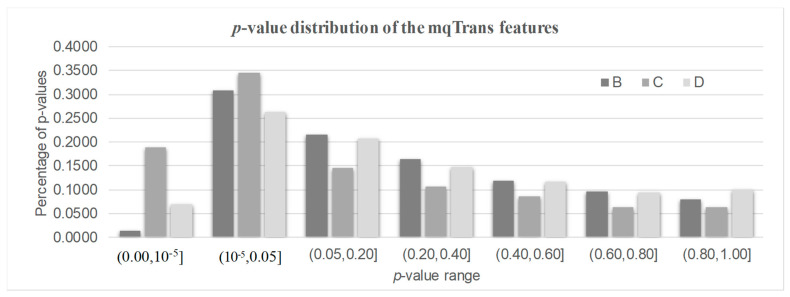
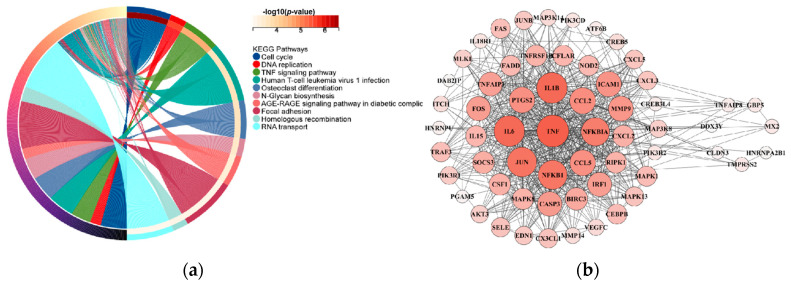
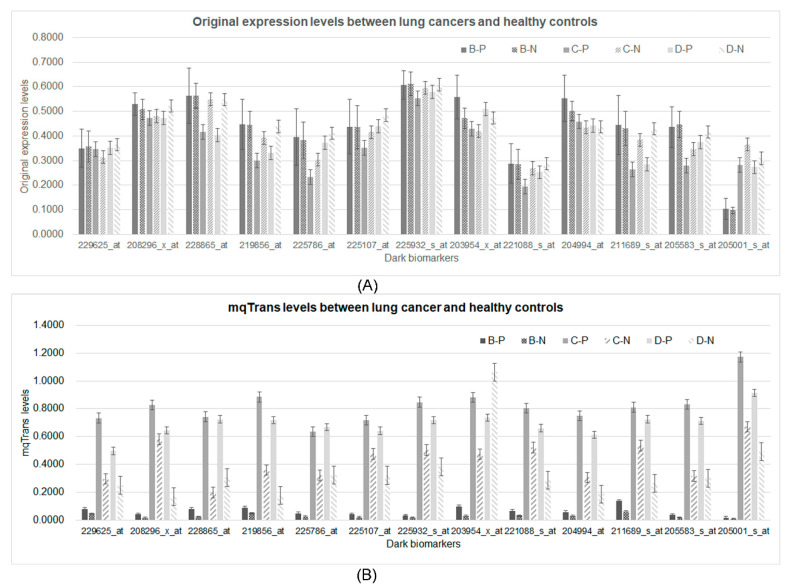
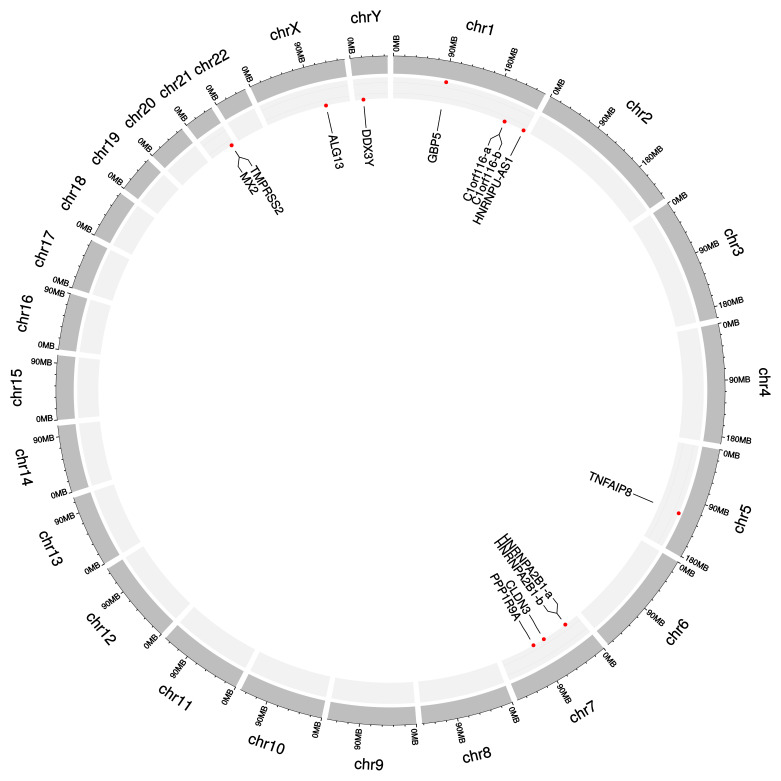
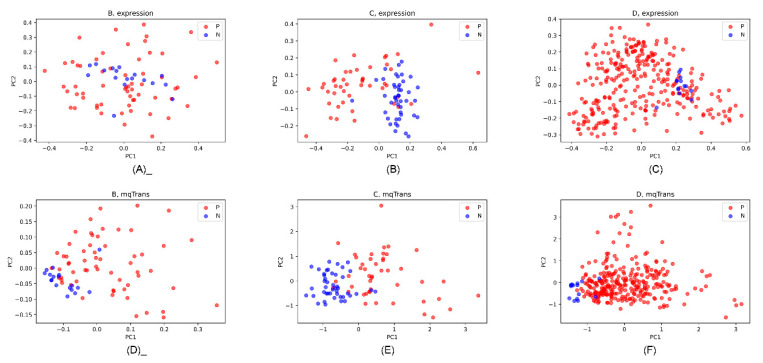
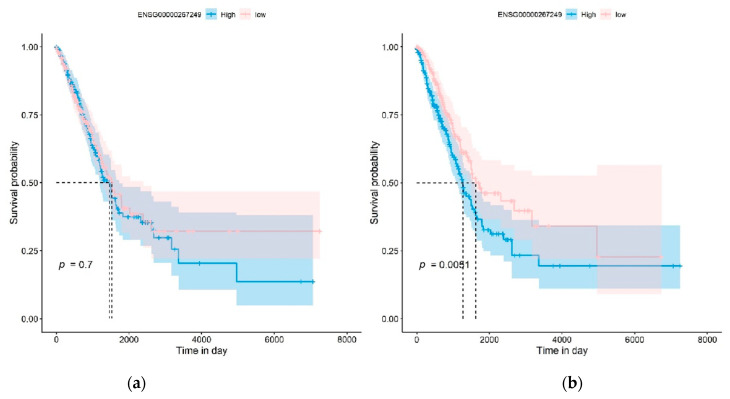
A transcriptome profiles the expression levels of genes in cells and has accumulated a huge amount of public data. Most of the existing biomarker-related studies investigated the differential expression of individual transcriptomic features under the assumption of inter-feature independence. Many transcriptomic features without differential expression were ignored from the biomarker lists. This study proposed a computational analysis protocol (mqTrans) to analyze transcriptomes from the view of high-dimensional inter-feature correlations. The mqTrans protocol trained a regression model to predict the expression of an mRNA feature from those of the transcription factors (TFs). The difference between the predicted and real expression of an mRNA feature in a query sample was defined as the mqTrans feature. The new mqTrans view facilitated the detection of thirteen transcriptomic features with differentially expressed mqTrans features, but without differential expression in the original transcriptomic values in three independent datasets of lung cancer. These features were called dark biomarkers because they would have been ignored in a conventional differential analysis. The detailed discussion of one dark biomarker, GBP5, and additional validation experiments suggested that the overlapping long non-coding RNAs might have contributed to this interesting phenomenon. In summary, this study aimed to find undifferentially expressed genes with significantly changed mqTrans values in lung cancer. These genes were usually ignored in most biomarker detection studies of undifferential expression. However, their differentially expressed mqTrans values in three independent datasets suggested their strong associations with lung cancer.

Keywords: bioinformatics; dark biomarker; differential expression; lung cancer; mqTrans; transcription regulation.


Conflict of interest statement

The authors declare that they have no known competing financial interests or personal relationships that could have appeared to influence the work reported in this paper.

Figures

Figure 1
Figure 1
Flowchart of the experimental design of this study.
Figure 2
Figure 2
The distribution of the PCC values of the transcriptomic features with a PCC > 0.5 in all four datasets. Dataset A consists of the 70% randomly chosen healthy control samples from dataset GSE33356 for training the mqTrans models, and the remaining samples of dataset GSE33356 constitutes dataset B. Datasets C and D represent datasets GSE18842 and GSE30219.
Figure 3
Figure 3
The distribution of the p-values of the mqTrans features in all three testing datasets. The 30% healthy controls and 100% lung cancer samples of dataset GSE33356 constitute dataset B. Datasets C and D represent datasets GSE18842 and GSE30219.
Figure 4
Figure 4
Lung cancer differentially expressed gene enrichment analysis and PPI network analysis of 13 dark biomarker genes. (a) The left side of the figure displays the top ten pathways from the KEGG enrichment analysis results. Specifically, we selected 54 genes in the TNF signaling pathway. (b) On the right side, the protein–protein interaction (PPI) analyses yield results indicating that seven dark biomarkers have node interactions with lung cancer significant difference genes.
Figure 5
Figure 5
Comparison of the 13 dark biomarkers from both the original expression and mqTrans levels. (A) The original expression levels and (B) the mqTrans levels of these 13 dark biomarkers are displayed. The two strong dark biomarkers are on the left-most part. The horizontal axis lists the 13 dark biomarkers. The vertical axis illustrates the values of the respective feature levels. The data series B-P and B-N are the lung cancer and healthy control samples in dataset B. The other four data series, C-P, C-N, D-P, and D-N, are defined for the lung cancer and healthy control samples in datasets C and D, respectively.
Figure 6
Figure 6
Circos plot of the 13 dark biomarkers in the human genome. The dark biomarkers are represented with the genes where they reside. The two strong dark biomarkers 229625_at (gene GBP5) and 208296_x_at (gene TNFAIP8) are highlighted in a larger size and red color. The two dark biomarkers 228865_at and 219856_at are both within the gene C1orf116, and they are denoted as C1orf116-a and C1orf116-b, respectively. Another pair of dark biomarkers, 225107_at and 225932_s_at, are from gene HNRNPA2B1, and they are denoted as HNRNPA2B1-a and HNRNPA2B1-b, respectively. The Circos plot was generated using the online version of shinyCircos.
Figure 7
Figure 7
PCA dot plots of the 13 dark biomarkers on the original expression and mqTrans levels in the three datasets. The first and second principal components (PC1 and PC2) are used as the horizontal and vertical axis. The lung cancer and healthy control samples are colored as red (P) and blue (N). The PCA dot plots of the original expression levels are for datasets (A) B, (B) C, and (C) D. The PCA dot plots of the mqTrans levels are also generated for the three datasets (D) B, (E) C, and (F) D.
Figure 8
Figure 8
Kaplan–Meier (KM) survival analysis of the dark biomarker ENSG00000267249 (gene symbol: RP11-973H7.3) in the LUAD experiment. The KM plots of (a) the original expression levels and (b) the mqTrans values of this dark biomarker are generated for LUAD, respectively.

Similar articles

Cited by

References

    1. Alberg A.J., Samet J.M. Epidemiology of lung cancer. Chest. 2008;3:592. - PubMed
    1. Ren Y., Zhao S., Jiang D., Xin F., Zhou F. Proteomic biomarkers for lung cancer progression. Biomark. Med. 2018;12:205. doi: 10.2217/bmm-2018-0015. - DOI - PubMed
    1. Gainor J.F., Tan D., Pas T.D., Solomon B.J., Ahmad A., Lazzari C., Marinis F.D., Spitaleri G., Schultz K., Friboulet L. Progression-Free and Overall Survival in ALK-Positive NSCLC Patients Treated with Sequential Crizotinib and Ceritinib. Clin. Cancer Res. 2016;21:2745–2752. doi: 10.1158/1078-0432.CCR-14-3009. - DOI - PMC - PubMed
    1. Whang-Peng J., Bunn P., Kao-Shan C.S., Lee E.C., Minna J.D. A nonrandom chromosomal abnormality, del 3p(14-23), in human small cell lung cancer (SCLC) Cancer Genet. Cytogenet. 1982;6:119–134. doi: 10.1016/0165-4608(82)90077-2. - DOI - PubMed
    1. Molinier O., Goupil F., Debieuvre D., Auliac J.B., Jeandeau S., Lacroix S., Martin F., Grivaux M. Five-year survival and prognostic factors according to histology in 6101 non-small-cell lung cancer patients. Respir. Med. Res. 2020;77:46–54. doi: 10.1016/j.resmer.2019.10.001. - DOI - PubMed

Publication types