. 2023 Nov 24;13(12):1633.
doi: 10.3390/brainsci13121633.

The Influence of Arsenic Co-Exposure in a Model of Alcohol-Induced Neurodegeneration in C57BL/6J Mice

Affiliations

The Influence of Arsenic Co-Exposure in a Model of Alcohol-Induced Neurodegeneration in C57BL/6J Mice

Tori R Sides et al. Brain Sci. .

Abstract

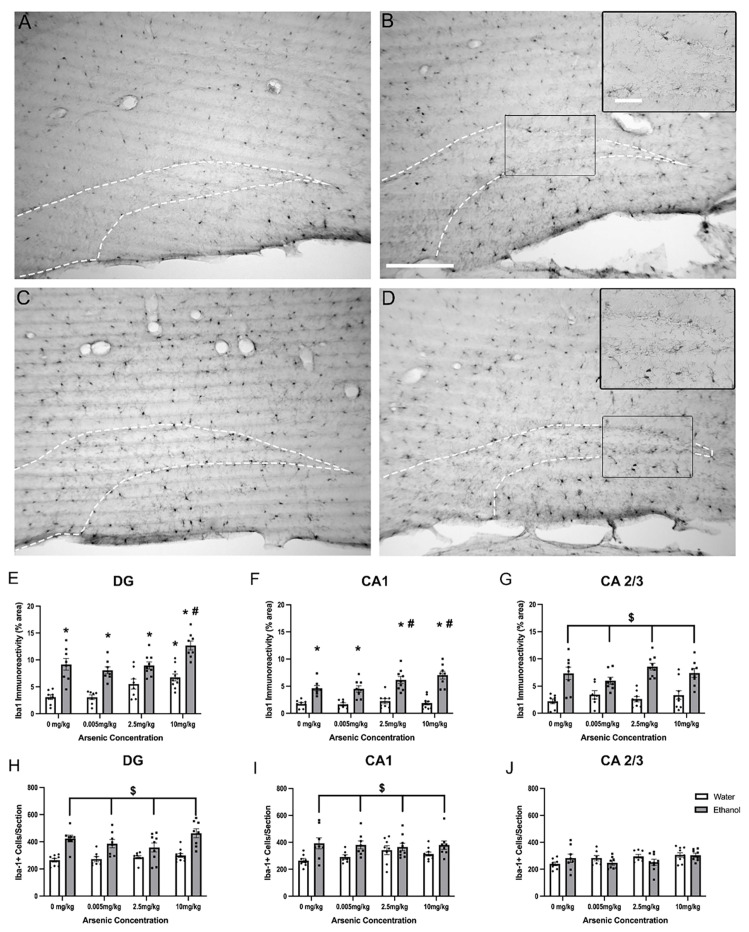
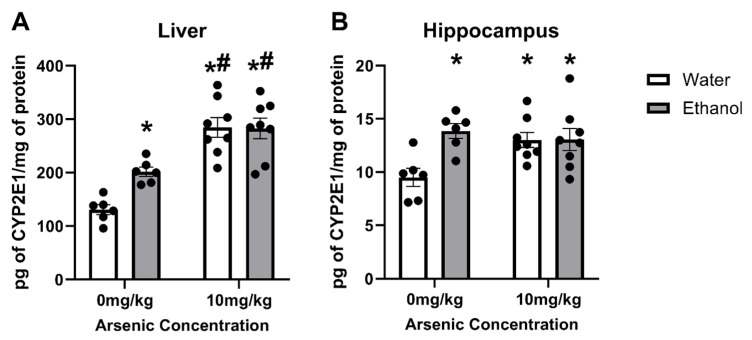
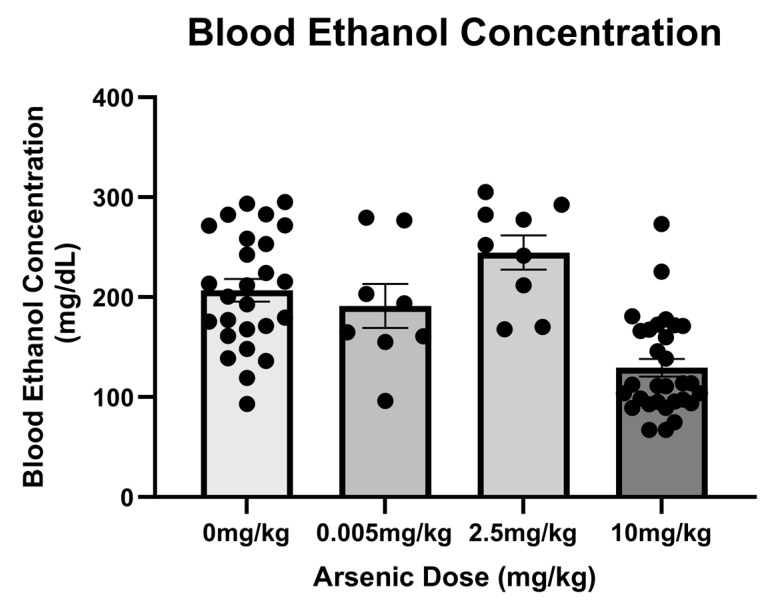
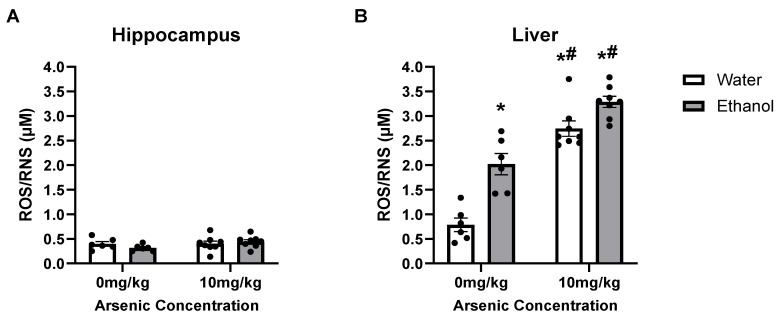
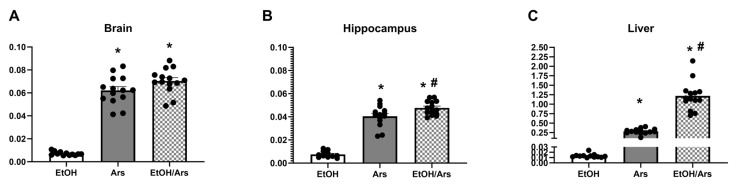
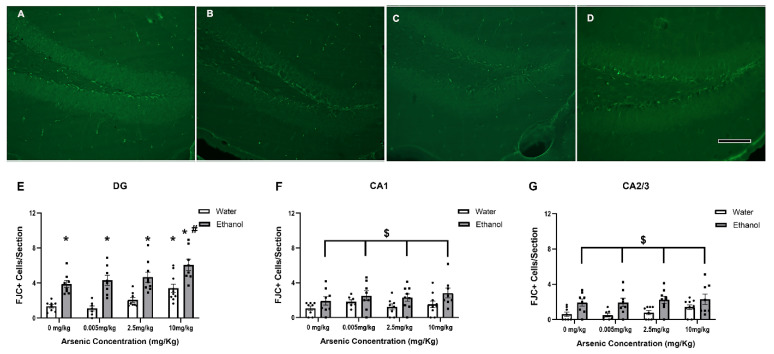
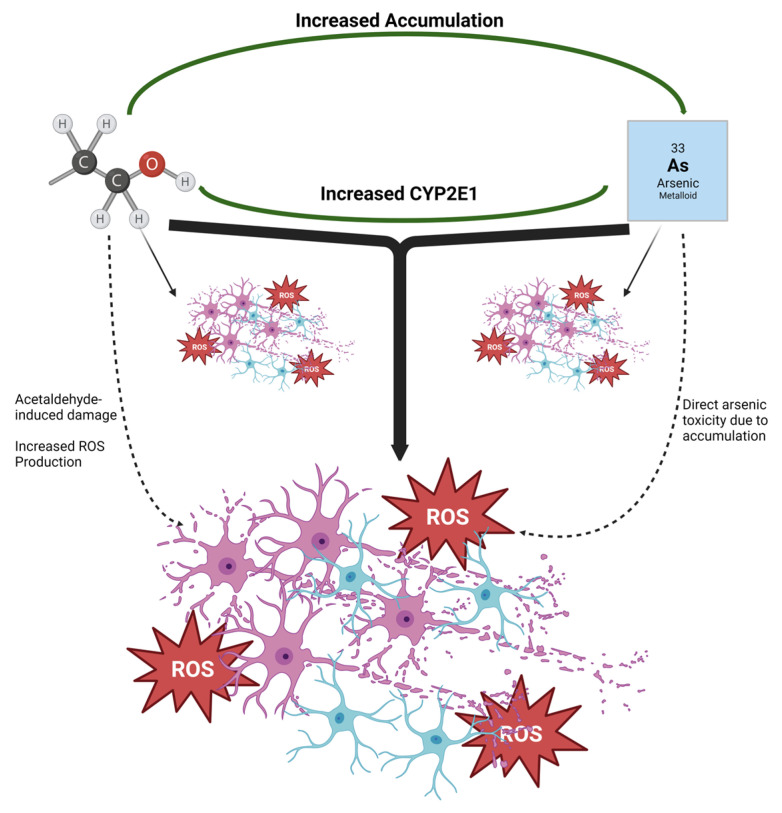
Both excessive alcohol consumption and exposure to high levels of arsenic can lead to neurodegeneration, especially in the hippocampus. Co-exposure to arsenic and alcohol can occur because an individual with an Alcohol Use Disorder (AUD) is exposed to arsenic in their drinking water or food or because of arsenic found directly in alcoholic beverages. This study aims to determine if co-exposure to alcohol and arsenic leads to worse outcomes in neurodegeneration and associated mechanisms that could lead to cell death. To study this, mice were exposed to a 10-day gavage model of alcohol-induced neurodegeneration with varying doses of arsenic (0, 0.005, 2.5, or 10 mg/kg). The following were examined after the last dose of ethanol: (1) microglia activation assessed via immunohistochemical detection of Iba-1, (2) reactive oxygen and nitrogen species (ROS/RNS) using a colorimetric assay, (3) neurodegeneration using Fluoro-Jade® C staining (FJC), and 4) arsenic absorption using ICP-MS. After exposure, there was an additive effect of the highest dose of arsenic (10 mg/kg) in the dentate gyrus of alcohol-induced FJC+ cells. This additional cell loss may have been due to the observed increase in microglial reactivity or increased arsenic absorption following co-exposure to ethanol and arsenic. The data also showed that arsenic caused an increase in CYP2E1 expression and ROS/RNS production in the hippocampus which could have independently contributed to increased neurodegeneration. Altogether, these findings suggest a potential cyclical impact of co-exposure to arsenic and ethanol as ethanol increases arsenic absorption but arsenic also enhances alcohol's deleterious effects in the CNS.

Keywords: CYP2E1; alcohol-related brain damage; arsenic toxicity; hippocampus; microglial activation; neuroimmune.


Conflict of interest statement

The authors declare no conflict of interest.

Figures

Figure 1
Figure 1
Additive Effects of Ethanol & Arsenic on Microglial Activation. Photomicrographs of the dentate gyrus suggest Ionized calcium-binding adapter molecule 1 (Iba-1) positive cells and immunoreactivity (IR) are increased (hilus outlined by the white dashes) in mice following a daily 10-day dose schedule of 10 mg/kg arsenic (B), 5 g/kg ethanol (C), ethanol and arsenic combined (D) compared to the water group (A). Ethanol alone led to an increase in Iba-1 IR throughout the hippocampus (EG), but only in the DG (E) did the highest dose of arsenic lead to significantly more Iba-1 pixels. Importantly, when the two were combined, there appeared to be an additive response to arsenic compared with the ethanol group in the DG (E) and CA1 (F). Ethanol also led to an increased number of Iba-1+ cells in the DG (H), and CA1 (I), but not the CA2/3 subregion (J), but arsenic did not seem to have an influence on cell number. Scale bar in (B) = 200 μm, inset scale bar = 50 μm (*, p < 0.05 compared with water only; #, p < 0.05 compared with ethanol only; $, p < 0.05 main effect of ethanol; circles represent the individual data points).
Figure 2
Figure 2
No additive effects of arsenic and ethanol on CYP2E1 expression in the liver or hippocampus. Arsenic (10 mg/kg) and ethanol (5 g/kg) lead to an increase in CYP2E1 concentration in the liver (A) and hippocampus (B). However, no additive or synergistic effects were observed when ethanol and arsenic were combined. (*, p < 0.05 compared with water; #, p < 0.05 compared with ethanol; circles represent the individual data points).
Figure 3
Figure 3
High Doses of Arsenic Increased Ethanol Clearance. The group receiving the highest dose of arsenic (10 mg/kg) had significantly lower BECs compared to other ethanol groups (circles represent the individual data points).
Figure 4
Figure 4
Ethanol had no additive effects on arsenic-induced ROS/RNS production. Arsenic exposure caused an increase in ROS/RNS in the liver (B) but not in the hippocampus (A), but there were no additive effects of ethanol to arsenic’s effects. (*, p < 0.05 compared with water; #, p < 0.05 compared with ethanol; circles represent the individual data points).
Figure 5
Figure 5
Ethanol increases arsenic absorption in the liver and hippocampus. ICP-MS measurements of arsenic (Ars) concentration showed the arsenic treatment effect was enhanced by ethanol in the hippocampus (B) and liver (C) but not in the brain (A). (*, p < 0.05 compared to ethanol alone; #, p < 0.05 compared with ethanol; circles represent the individual data points).
Figure 6
Figure 6
Arsenic enhances ethanol-induced neurodegeneration in the DG. Photomicrographs of FJC-positive cells in the DG suggest that arsenic (B) and ethanol (C) were associated with more cell death compared with the control (A), but this effect was enhanced when arsenic and ethanol were combined (D). Quantification of these cells indicated that arsenic led to a more robust response to ethanol in the DG (E). However, there was only an effect of ethanol in the CA1 (F) and CA2/3 (G). Scale bar in (D) = 25μm (*, p < 0.05 compared with water only; #, p < 0.05 compared with ethanol only; $, p < 0.05 main effect of ethanol; circles represent the individual data points).
Figure 7
Figure 7
Additive effects of ethanol and arsenic on neurodegeneration. Both ethanol and arsenic led to neurodegeneration, microglial activation, and ROS production with these negative effects being additive with co-exposure. Alcohol increased arsenic accumulation in the hippocampus and liver which may have influenced arsenic toxicity explaining the additive effects of co-exposure. Likewise, the additive effect of co-exposure could be associated with arsenic’s increase in CYP2E1 which had the potential to lead to an increase in both acetaldehyde and ROS production. Solid lines represent the current data whereas the dashed lines are suggestions of potential mechanisms.

References

    1. GBD 2016 Alcohol and Drug Use Collaborators The global burden of disease attributable to alcohol and drug use in 195 countries and territories, 1990-2016: A systematic analysis for the Global Burden of Disease Study 2016. Lancet Psychiatry. 2018;5:987–1012. doi: 10.1016/S2215-0366(18)30337-7. - DOI - PMC - PubMed
    1. Robinson E., Humphreys G., Jones A. Alcohol, calories, and obesity: A rapid systematic review and meta-analysis of consumer knowledge, support, and behavioral effects of energy labeling on alcoholic drinks. Obes. Rev. 2021;22:e13198. doi: 10.1111/obr.13198. - DOI - PubMed
    1. Nielsen S.J., Kit B.K., Fakhouri T., Ogden C.L. Calories consumed from alcoholic beverages by U.S. adults, 2007–2010. NCHS Data Brief. 2012;110:1–8. - PubMed
    1. Huang W.J., Zhang X., Chen W.W. Association between alcohol and Alzheimer’s disease. Exp. Ther. Med. 2016;12:1247–1250. doi: 10.3892/etm.2016.3455. - DOI - PMC - PubMed
    1. Zahr N.M., Kaufman K.L., Harper C.G. Clinical and pathological features of alcohol-related brain damage. Nat. Rev. Neurol. 2011;7:284–294. doi: 10.1038/nrneurol.2011.42. - DOI - PMC - PubMed

LinkOut - more resources