. 2023 Dec 10;12(24):4426.
doi: 10.3390/foods12244426.

A Machine Learning Approach Investigating Consumers' Familiarity with and Involvement in the Just Noticeable Color Difference and Cured Color Characterization Scale

Affiliations

A Machine Learning Approach Investigating Consumers' Familiarity with and Involvement in the Just Noticeable Color Difference and Cured Color Characterization Scale

Guillermo Ripoll et al. Foods. .

Abstract

The aim of this study was to elucidate the relations between the visual color perception and the instrumental color of dry-cured ham, with a specific focus on determining the Just Noticeable Color Difference (JNCD). Additionally, we studied the influence of consumer involvement and familiarity on color-related associations and JNCD. Slices of ham were examined to determine their instrumental color and photos were taken. Consumers were surveyed about color scoring and matching of the pictures; they were also asked about their involvement in food, familiarity with cured ham, and sociodemographic characteristics. Consumers were clustered according to their level of involvement and the JNCD was calculated for the clusters. An interpretable machine learning algorithm was used to relate the visual appraisal to the instrumental color. A JNCD of ΔEab* = 6.2 was established, although it was lower for younger people. ΔEab* was also influenced by the involvement of consumers. The machine-learning algorithm results were better than those obtained via multiple linear regressions when consumers' psychographic characteristics were included. The most important color variables of the algorithm were L* and hab. The findings of this research underscore the impact of consumers' involvement and familiarity with dry-cured ham on their perception of color.

Keywords: JNCD; JND; consumer; delta E; difference; just-noticeable; machine learning.


Conflict of interest statement

The authors declare no conflict of interest. The funders had no role in the design of the study; in the collection, analyses, or interpretation of data; in the writing of the manuscript; or in the decision to publish the results.

Figures

Figure 1
Figure 1
Scheme of the experimental flow from the sampling of hams (1), following the data collection through measurement of instrumental color (2, 3 and 4) and the online surveys completed by consumers (5) until the clustering of consumers according to the involvement scale (6), the estimation of the Just noticeable Color Difference according to the characteristics of consumers (7), and the relationship between the visual appraisal of consumers using the Cured Color Classification and characteristics of consumers. Red lines are the inputs of steps (6) and (7), and blue lines are the inputs of the (8)th step.
Figure 2
Figure 2
Pair of region of interest (ROI) of biceps femoris muscle corresponding with a ΔEab* = 8.0. ROIs are squares of 3 × 3 cm with a 1.5-width white background between them.
Figure 3
Figure 3
Statistics of instrumental color of dry-cured ham. The box of a boxplot starts in the first quartile (25%) and ends in the third (75%). The black line inside the box represents the median and the red cross represent the average. The segments on each side of the box extend to one and a half times the interquartile range. L* = lightness, 0 to100. a* = redness index and b* = yellowness index are unbound, usual limits −128 to +128. Cab* = Chroma; hab= hue angle.
Figure 4
Figure 4
(a,b) Differences between involvement profiles of consumers. Bars with different letters (a,b,c) means significant differences at p < 0.05 level. FIS scale: 1. I do not think much about food each day; 2. Cooking or barbequing is not much fun; 3. Talking about what I ate or am going to eat is something I like to do; 4. Compared with other daily decisions, my food choices are not very important; 5. When I travel, one of the things I anticipate most is eating the food there; 6. I do most or all of the clean up after eating; 7. I enjoy cooking for others and myself; 8. When I eat out, I don’t think or talk much about how the food taste; 9. I do not like to mix or chop food; 10. I do most or all of my own food shopping; 11. I do not wash dishes or clean the table; 12. I care whether or not a table is nicely set. Item reversely scaled. Seven-point Likert scales, ranging from 1 = “disagree strongly” to 7 = “agree strongly”. The scale of each figure is adjusted to the scale used for FIS, P&E and S&D and the red line is the theoretical middle point of scale. Cluster 1 participants are called providers, Cluster 2 participants are called eaters, and Cluster 3 participants are called foodies.
Figure 5
Figure 5
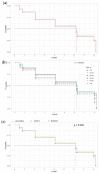
Kaplan–Meier survival curves (a) all data, (b) per age, (c) per cluster.
Figure 6
Figure 6
Coefficient of determination (R2) and residual standard error (RSE) of the multiple linear regressions (MLR) and Cubist machine learning algorithm with or without psychographic characteristics (PC) relating instrumental color to Cured Color Classification.

References

    1. MAPA Home Consumption Database. [(accessed on 1 May 2022)]. Available online: https://www.mapa.gob.es/app/consumo-en-hogares/consulta.asp.
    1. Mancini R.A., Hunt M.C. Current Research in Meat Color. Meat Sci. 2005;71:100–121. doi: 10.1016/j.meatsci.2005.03.003. - DOI - PubMed
    1. Bernués A., Ripoll G., Panea B. Consumer Segmentation Based on Convenience Orientation and Attitudes towards Quality Attributes of Lamb Meat. Food Qual. Prefer. 2012;26:211–220. doi: 10.1016/j.foodqual.2012.04.008. - DOI
    1. Ripoll G., Panea B., Albertí P. Visual Appraisal of Beef: Relationship with CIELab Colour Space. Itea-Inf. Tec. Econ. Agrar. 2012;108:222–232. doi: 10.13140/RG.2.2.25240.19201. - DOI
    1. Holman B.W.B., Mao Y., Coombs C.E.O., van de Ven R.J., Hopkins D.L. Relationship between Colorimetric (Instrumental) Evaluation and Consumer-Defined Beef Colour Acceptability. Meat Sci. 2016;121:104–106. doi: 10.1016/j.meatsci.2016.05.002. - DOI - PubMed

LinkOut - more resources