

Effects of Fermentation with Tetragenococcus halophilus and Zygosaccharomyces rouxii on the Volatile Profiles of Soybean Protein Hydrolysates
- PMID: 38137316
- PMCID: PMC10742455
- DOI: 10.3390/foods12244513
Effects of Fermentation with Tetragenococcus halophilus and Zygosaccharomyces rouxii on the Volatile Profiles of Soybean Protein Hydrolysates
Abstract
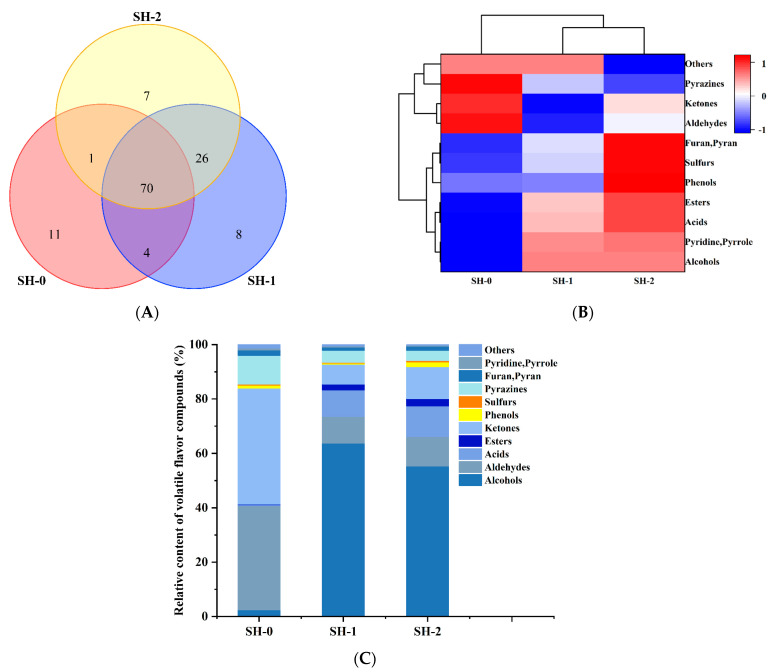
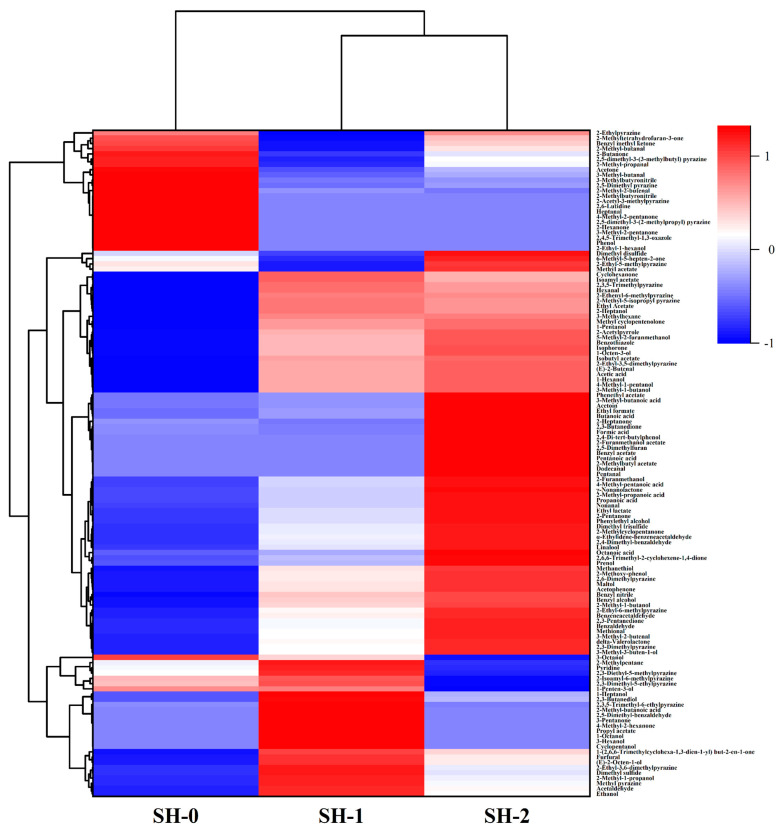
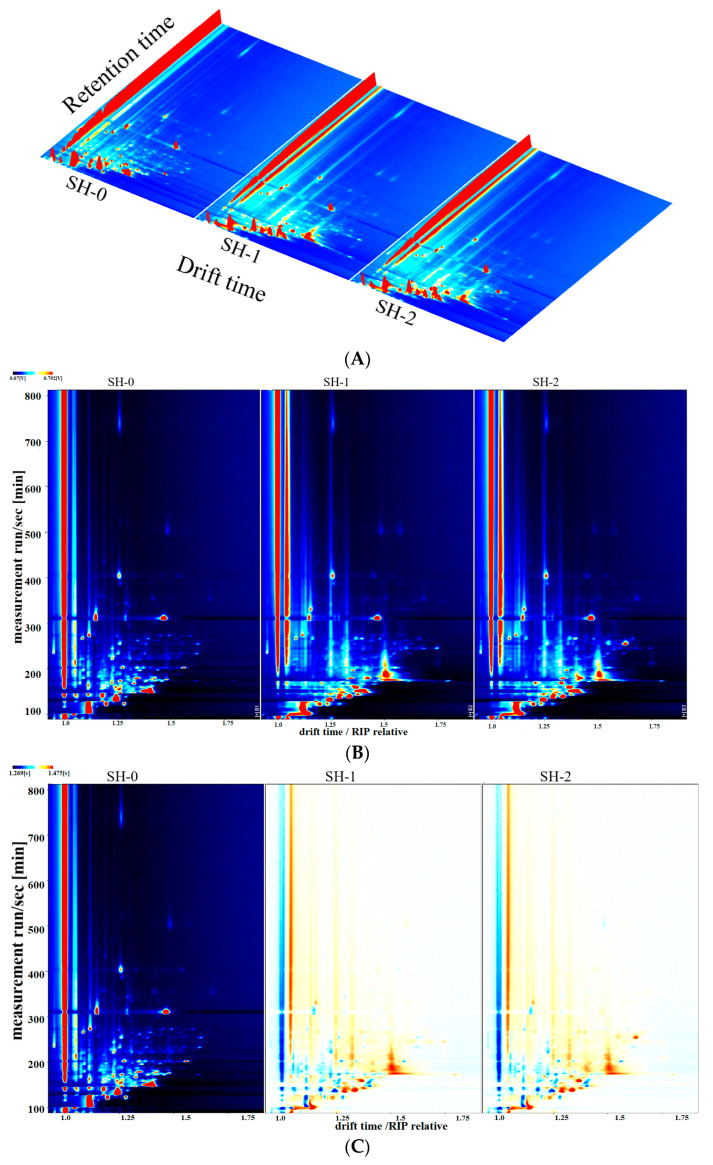
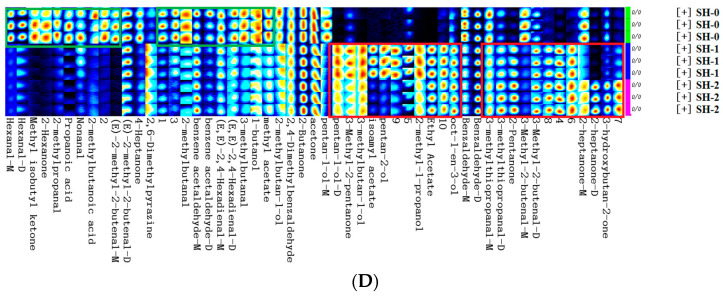
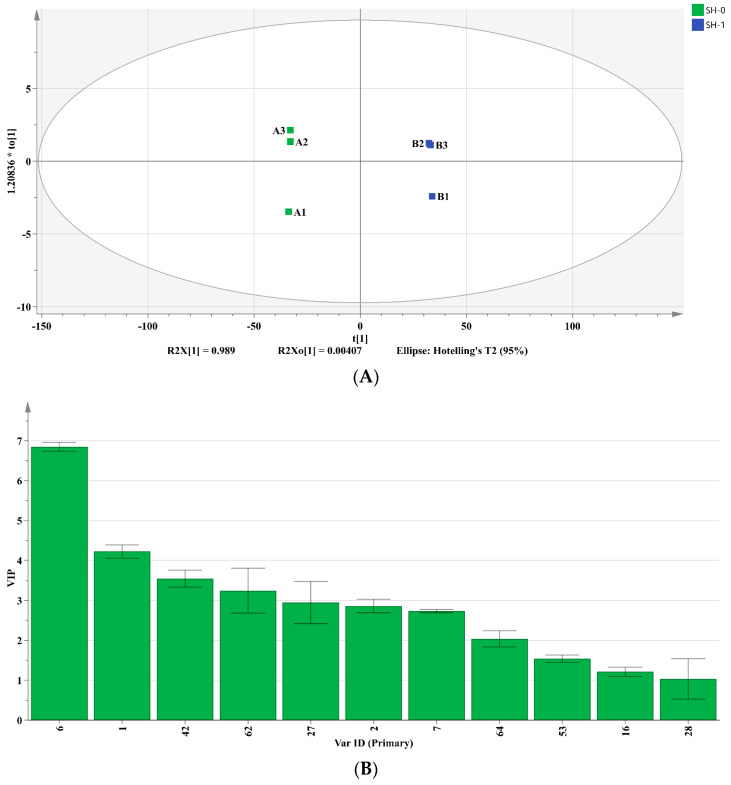
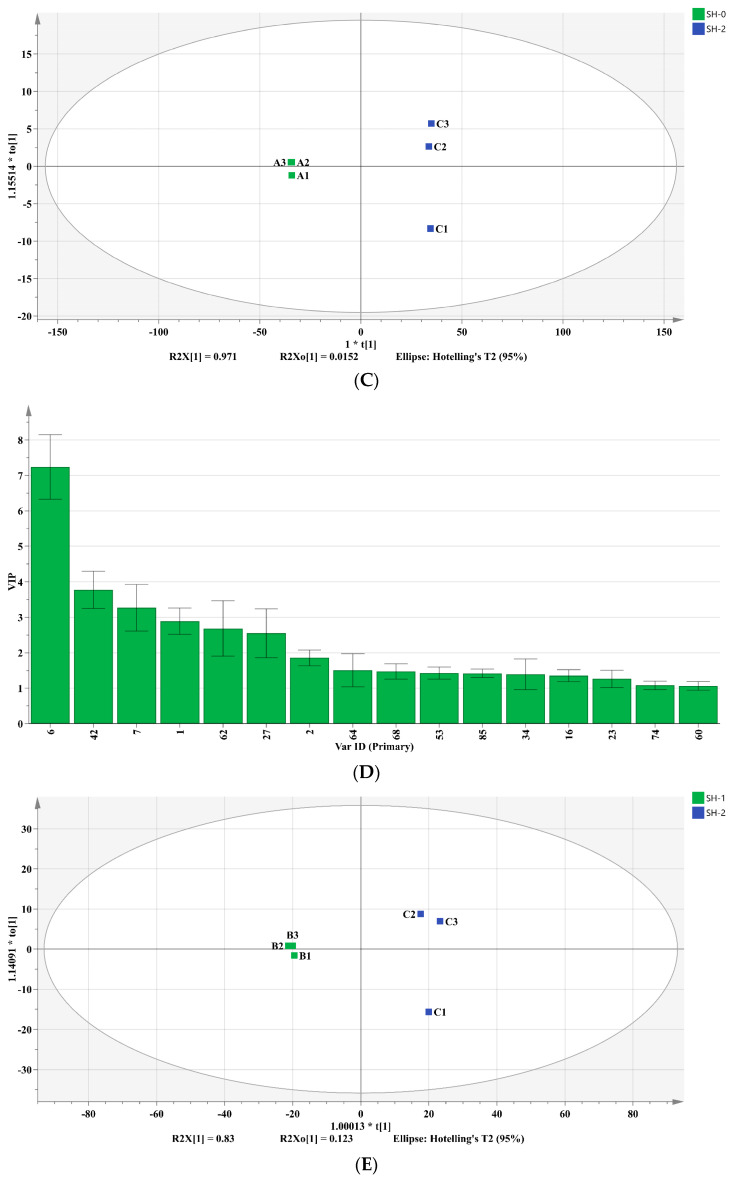
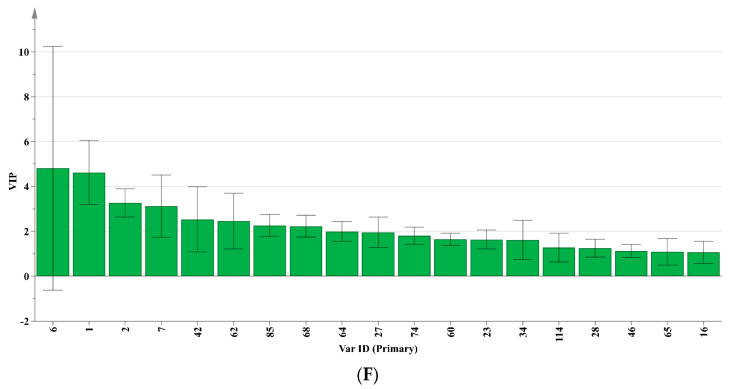
The effects of fermentation with lactic acid bacteria (LAB) and yeast on the aroma of samples were analyzed in this work. The volatile features of different soybean hydrolysates were investigated using both GC-MS and GC-IMS. Only 47 volatile flavor compounds (VFCs) were detected when using GC-IMS, while a combination of GC-MS and GC-IMS resulted in the identification of 150 compounds. LAB-yeast fermentation could significantly increase the diversity and concentrations of VFCs (p < 0.05), including alcohols, acids, esters, and sulfurs, while reduce the contents of aldehydes and ketones. Hierarchical clustering and orthogonal partial least squares analyses confirmed the impact of fermentation on the VFCs of the hydrolysates. Seven compounds were identified as significant compounds distinguishing the aromas of different groups. The partial least squares regression analysis of the 25 key VFCs (ROAV > 1) and sensory results revealed that the treatment groups positively correlated with aromatic, caramel, sour, overall aroma, and most of the key VFCs. In summary, fermentation effectively reduced the fatty and bean-like flavors of soybean hydrolysates, enhancing the overall flavor quality, with sequential inoculation proving to be more effective than simultaneous inoculation. These findings provided a theoretical basis for improving and assessing the flavor of soybean protein hydrolysates.
Keywords: GC-IMS; GC-MS; lactic acid bacteria; soybean protein hydrolysates; volatile flavor compounds; yeast.
Conflict of interest statement
The authors declare no conflict of interest.
Figures

Similar articles
-
Effects of co-inoculation and sequential inoculation of Tetragenococcus halophilus and Zygosaccharomyces rouxii on soy sauce fermentation.Food Chem. 2018 Feb 1;240:1-8. doi: 10.1016/j.foodchem.2017.07.094. Epub 2017 Jul 19. Food Chem. 2018. PMID: 28946215
-
Evaluation of differences in volatile flavor compounds between liquid-state and solid-state fermented Tartary buckwheat by Monascus purpureus.Food Chem. 2025 Feb 1;464(Pt 1):141662. doi: 10.1016/j.foodchem.2024.141662. Epub 2024 Oct 15. Food Chem. 2025. PMID: 39423523
-
Fermentation-promoting effect of three salt-tolerant Staphylococcus and their co-fermentation flavor characteristics with Zygosaccharomyces rouxii in soy sauce brewing.Food Chem. 2024 Jan 30;432:137245. doi: 10.1016/j.foodchem.2023.137245. Epub 2023 Aug 23. Food Chem. 2024. PMID: 37657348
-
Analysis of Volatile Flavor Substances in the Enzymatic Hydrolysate of Lanmaoa asiatica Mushroom and Its Maillard Reaction Products Based on E-Nose and GC-IMS.Foods. 2022 Dec 15;11(24):4056. doi: 10.3390/foods11244056. Foods. 2022. PMID: 36553801 Free PMC article.
-
Volatile flavor compounds in yogurt: a review.Crit Rev Food Sci Nutr. 2010 Nov;50(10):938-50. doi: 10.1080/10408390903044081. Crit Rev Food Sci Nutr. 2010. PMID: 21108074 Review.
Cited by
-
Fermented Plant-Based Milks Based on Chestnut and Soybean: Comprehensive Evaluation of Fermentation Characteristics and Aroma Profiles Using Four Lactic Acid Bacteria Strains.Foods. 2025 Jul 17;14(14):2511. doi: 10.3390/foods14142511. Foods. 2025. PMID: 40724329 Free PMC article.
-
Effect of Corynebacterium glutamicum Fermentation on the Volatile Flavors of the Enzymatic Hydrolysate of Soybean Protein Isolate.Foods. 2024 Aug 19;13(16):2591. doi: 10.3390/foods13162591. Foods. 2024. PMID: 39200518 Free PMC article.
-
The potential meat flavoring derived from Maillard reaction products of rice protein isolate hydrolysate-xylose via the regulation of temperature and cysteine.Food Chem X. 2024 May 18;22:101491. doi: 10.1016/j.fochx.2024.101491. eCollection 2024 Jun 30. Food Chem X. 2024. PMID: 38840727 Free PMC article.
References
-
- Zhao H., Wan C., Zhao M., Lei H., Mo F. Effects of soy protein hydrolysates on the growth and fermentation performances of brewer’s yeast. Int. J. Food Sci. Technol. 2014;49:2015–2022. doi: 10.1111/ijfs.12503. - DOI
-
- Ashaolu T.J. Health Applications of Soy Protein Hydrolysates. Int. J. Pept. Res. Ther. 2020;26:2333–2343. doi: 10.1007/s10989-020-10018-6. - DOI
-
- Zhao Y., Zhao X., Sun-Waterhouse D., Waterhouse G.I.N., Zhao M., Zhang J., Wang F., Su G. Two-stage selective enzymatic hydrolysis generates protein hydrolysates rich in Asn-Pro and Ala-His for enhancing taste attributes of soy sauce. Food Chem. 2021;345:128803. doi: 10.1016/j.foodchem.2020.128803. - DOI - PubMed
-
- Anh T.L.Q., Hoa N.T.Q., Nguyen P.D.T., Thanh H.V., Nguyen P.B., Anh L.T.H., Dao D.T.A. Soybean Protein Extraction by Alcalase and Flavourzyme, Combining Thermal Pretreatment for Enteral Feeding Product. Catalysts. 2020;10:829. doi: 10.3390/catal10080829. - DOI
Grants and funding
LinkOut - more resources
Full Text Sources
Miscellaneous
