Gene Signature Associated with Nervous System in an Experimental Radiation- and Estrogen-Induced Breast Cancer Model
- PMID: 38137332
- PMCID: PMC10740914
- DOI: 10.3390/biomedicines11123111
Gene Signature Associated with Nervous System in an Experimental Radiation- and Estrogen-Induced Breast Cancer Model
Abstract
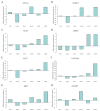
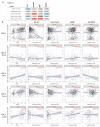
Breast cancer is frequently the most diagnosed female cancer in the world. The experimental studies on cancer seldom focus on the relationship between the central nervous system and cancer. Despite extensive research into the treatment of breast cancer, chemotherapy resistance is an important issue limiting the efficacy of treatment. Novel biomarkers to predict prognosis or sensitivity to chemotherapy are urgently needed. This study examined nervous-system-related genes. The profiling of differentially expressed genes indicated that high-LET radiation, such as that emitted by radon progeny, in the presence of estrogen, induced a cascade of events indicative of tumorigenicity in human breast epithelial cells. Bioinformatic tools allowed us to analyze the genes involved in breast cancer and associated with the nervous system. The results indicated that the gene expression of the Ephrin A1 gene (EFNA1), the roundabout guidance receptor 1 (ROBO1), and the kallikrein-related peptidase 6 (KLK6) was greater in T2 and A5 than in the A3 cell line; the LIM domain kinase 2 gene (LIMK2) was greater in T2 than A3 and A5; the kallikrein-related peptidase 7 (KLK7), the neuroligin 4 X-linked gene (NLGN4X), and myelin basic protein (MBP) were greater than A3 only in T2; and the neural precursor cell expressed, developmentally down-regulated 9 gene (NEDD9) was greater in A5 than in the A3 and E cell lines. Concerning the correlation, it was found a positive correlation between ESR1 and EFNA1 in BRCA-LumA patients; with ROBO1 in BRCA-Basal patients, but this correlation was negative with the kallikrein-related peptidase 6 (KLK6) in BRCA-LumA and -LumB, as well as with LIMK2 and ROBO1 in all BRCA. It was also positive with neuroligin 4 X-linked (NLGN4X) in BRCA-Her2 and BRCA-LumB, and with MBP in BRCA-LumA and -LumB, but negative with KLK7 in all BRCA and BRCA-LumA and NEDD9 in BRCA-Her2. The differential gene expression levels between the tumor and adjacent tissue indicated that the ROBO1, KLK6, LIMK2, KLK7, NLGN4X, MBP, and NEDD9 gene expression levels were higher in normal tissues than in tumors; however, EFNA1 was higher in the tumor than the normal ones. EFNA1, LIMK2, ROBO1, KLK6, KLK7, and MBP gene expression had a negative ER status, whereas NEDD9 and NLGN4X were not significant concerning ER status. In conclusion, important markers have been analyzed concerning genes related to the nervous system, opening up a new avenue of studies in breast cancer therapy.
Keywords: axon guidance; breast cancer; neural precursors; neuronal markers; neurotransmitter; radiation.
Conflict of interest statement
The authors declare no conflict of interest. The funders had no role in the design of the study; in the collection, analyses, or interpretation of data; in the writing of the manuscript; or in the decision to publish the results.
Figures


Similar articles
-
Ionizing Radiation and Estrogen Affecting Growth Factor Genes in an Experimental Breast Cancer Model.Int J Mol Sci. 2022 Nov 18;23(22):14284. doi: 10.3390/ijms232214284. Int J Mol Sci. 2022. PMID: 36430763 Free PMC article.
-
Nuclear PDCD4 Expression Defines a Subset of Luminal B-Like Breast Cancers with Good Prognosis.Horm Cancer. 2020 Oct;11(5-6):218-239. doi: 10.1007/s12672-020-00392-4. Epub 2020 Jul 6. Horm Cancer. 2020. PMID: 32632815 Free PMC article.
-
Expression Pattern and Prognostic Value of EPHA/EFNA in Breast Cancer by Bioinformatics Analysis: Revealing Its Importance in Chemotherapy.Biomed Res Int. 2021 Apr 22;2021:5575704. doi: 10.1155/2021/5575704. eCollection 2021. Biomed Res Int. 2021. PMID: 33977106 Free PMC article.
-
Prognostic value of intrinsic subtypes in hormone-receptor-positive metastatic breast cancer: systematic review and meta-analysis.ESMO Open. 2023 Jun;8(3):101214. doi: 10.1016/j.esmoop.2023.101214. Epub 2023 Apr 17. ESMO Open. 2023. PMID: 37075698 Free PMC article.
-
Gene Signatures Induced by Ionizing Radiation as Prognostic Tools in an In Vitro Experimental Breast Cancer Model.Cancers (Basel). 2021 Sep 12;13(18):4571. doi: 10.3390/cancers13184571. Cancers (Basel). 2021. PMID: 34572798 Free PMC article. Review.
Cited by
-
Association of Inflammation and Immune Cell Infiltration with Estrogen Receptor Alpha in an Estrogen and Ionizing Radiation-Induced Breast Cancer Model.Int J Mol Sci. 2024 Aug 7;25(16):8604. doi: 10.3390/ijms25168604. Int J Mol Sci. 2024. PMID: 39201290 Free PMC article.
References
-
- Kuchenbaecker K.B., Hopper J.L., Barnes D.R., Phillips K.A., Mooij T.M., Roos-Blom M.J., Jervis S., van Leeuwen F.E., Milne R.L., Andrieu N., et al. Risks of Breast, Ovarian, and Contralateral Breast Cancer for BRCA1 and BRCA2 Mutation Carriers. JAMA. 2017;317:2402–2416. doi: 10.1001/jama.2017.7112. - DOI - PubMed
Grants and funding
LinkOut - more resources
Full Text Sources
Research Materials
Miscellaneous

