Review
. 2023 Nov 30;14(12):2193.
doi: 10.3390/mi14122193.

Radiation Synthesis of High-Temperature Wide-Bandgap Ceramics

Affiliations
Review

Radiation Synthesis of High-Temperature Wide-Bandgap Ceramics

Victor Lisitsyn et al. Micromachines (Basel). .

Abstract

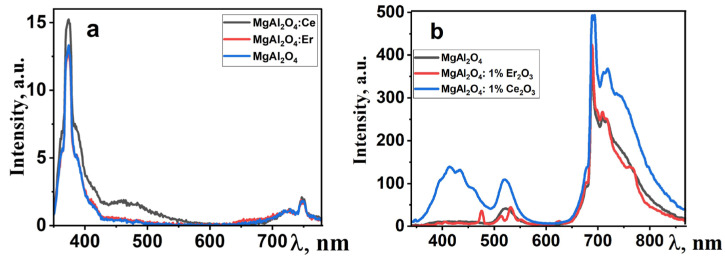
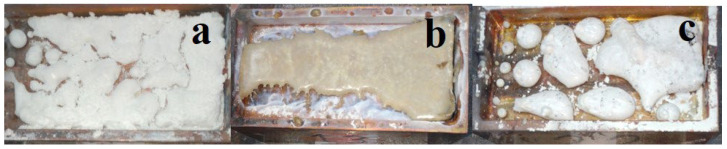
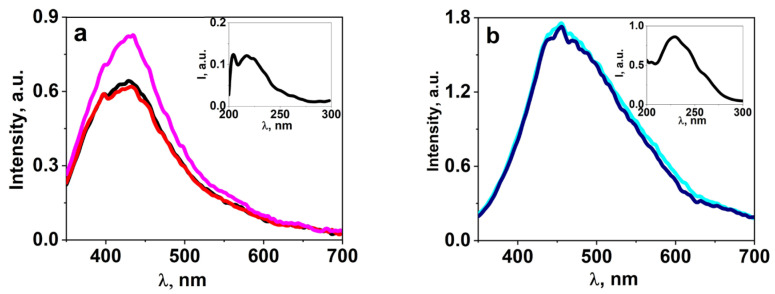
This paper presents the results of ceramic synthesis in the field of a powerful flux of high-energy electrons on powder mixtures. The synthesis is carried out via the direct exposure of the radiation flux to a mixture with high speed (up to 10 g/s) and efficiency without the use of any methods or means for stimulation. These synthesis qualities provide the opportunity to optimize compositions and conditions in a short time while maintaining the purity of the ceramics. The possibility of synthesizing ceramics from powders of metal oxides and fluorides (MgF2, BaF2, WO3, Ga2O3, Al2O3, Y2O3, ZrO2, MgO) and complex compounds from their stoichiometric mixtures (Y3Al3O12, Y3AlxGa(5-x) O12, MgAl2O4, ZnAl2O4, MgWO4, ZnWO4, BaxMg(2-x) F4), including activators, is demonstrated. The ceramics synthesized in the field of high-energy electron flux have a structure and luminescence properties similar to those obtained by other methods, such as thermal methods. The results of studying the processes of energy transfer of the electron beam mixture, quantitative assessments of the distribution of absorbed energy, and the dissipation of this energy are presented. The optimal conditions for beam treatment of the mixture during synthesis are determined. It is shown that the efficiency of radiation synthesis of ceramics depends on the particle dispersion of the initial powders. Powders with particle sizes of 1-10 µm, uniform for the synthesis of ceramics of complex compositions, are optimal. A hypothesis is put forward that ionization processes, resulting in the radiolysis of particles and the exchange of elements in the ion-electron plasma, dominate in the formation of new structural phases during radiation synthesis.

Keywords: ceramics; high-power electron flux; luminescence; radiation synthesis; refractory dielectric materials.


Conflict of interest statement

The authors declare no conflict of interest.

Figures

Figure 1
Figure 1
Photographs of YAG:Ce samples synthesized under the influence of an electron beam with E = 1.4 MeV: (a) P = 22 kW/cm2, R1; b,b1 P = 5 kW/cm2, R2 in crucibles; (b) removed from the crucible; (b1) traces of the impact of beams with P = 27 and 22 kW/cm2, R1 mode, on a steel plate (c1,c2).
Figure 2
Figure 2
Diffraction patterns of YAG samples: (a) 1 (solid line) and 2 (dotted line); (b) 3 (solid line) and 4 (dotted line). Reflexes belonging to accompanying phases are marked with the symbol ◊.
Figure 3
Figure 3
Excitation, luminescence (a), and decay kinetics spectra (b) of synthesized YAG: Ce ceramics.
Figure 4
Figure 4
Photographs of MgAl2O4 (a) and ZnAl2O4 (b) sample synthesized at 27 kW/cm2.
Figure 5
Figure 5
XRD spectra of MgAl2O4 spinel, pure and doped Ce and Er ions.
Figure 6
Figure 6
Photoluminescence (a) and cathodoluminescence (b) images of polycrystalline spinel samples doped with rare-earth elements.
Figure 7
Figure 7
Photographs of activated W samples of BaF2 (a), MgF2 (b), and BaMgF4 (c) ceramics synthesized under the influence of an electron beam with E = 1.4 MeV, P = 15 kW/cm2, R1.
Figure 8
Figure 8
The FL spectra of BaMgF4 (a) samples under excitation at 220 nm, as well as BaMgF4:W (b), BaF2:WO3 (c), and MgF2:WO3 (d) samples under excitation in the 260 nm range.
Figure 8
Figure 8
The FL spectra of BaMgF4 (a) samples under excitation at 220 nm, as well as BaMgF4:W (b), BaF2:WO3 (c), and MgF2:WO3 (d) samples under excitation in the 260 nm range.
Figure 9
Figure 9
Kinetic decay curves of CL in ceramic samples.
Figure 10
Figure 10
Photographs of ceramic samples (a) ZnWO4, (b) MgWO4, (c) CaWO4, synthesized under the influence of an electron beam with E = 1.4 MeV, P = 18 kW/cm2, R1.
Figure 11
Figure 11
SEM images of the surface of ceramic samples (a,a′)ZnWO4, (b,b′) MgWO4, and (c,c′) CaWO4 synthesized under the influence of an electron beam with E = 1.4 MeV, P = 18 kW/cm2, R1.
Figure 12
Figure 12
Photographs of synthesized ceramic samples under the influence of a 1.4 MeV electron beam in mode R1: Y2O3; Al2O3; MgO; ZrO2 (P = 25 kW); ZnO (P = 22 kW); Ga2O3 (P = 18 kW); WO3 (P = 17 kW); MgF2 (P = 15 kW).
Figure 13
Figure 13
Microphotographs of the initial aluminum oxide powders on zoom.
Figure 14
Figure 14
Dependence of the quantity of particles and volume on their sizes in the initial powders of MgO, Al2O3, and Y2O3. (Left) dispersion by volume; (right) dispersion by quantity of particles.
Figure 15
Figure 15
Energy loss distribution of electrons with E = 1.4, 2.0, 2.5 MeV in a mixture with a bulk density of 1.2 g/cm3 for the synthesis of Y3Al5O12 ceramics. Colored lines of equal losses are presented in units relative to the losses at the center.
Figure 16
Figure 16
Profiles of energy loss distributions dE/dx (a), dE/dy (b) for electrons with energies of 1.4, 2.0, 2.5 MeV in a target, and the absorbed energy density W (c).
Figure 17
Figure 17
Photographs of ceramic samples synthesized under the exposed of electron fluxes with E = 1.4 MeV (P = 4—2.5 kW/cm2), E = 2.5 MeV (P= 10 and 8 kW/cm2), and traces of the impact of electron flows with E = 1.4 MeV (P = 8, 10, 14 kW/cm2) on the copper plate.
Figure 18
Figure 18
Photographs of YAG:Ce ceramic samples synthesized under the influence of electron beams with different values of E and P are as follows: 1—E = 1.4 MeV, P = 2.5 kW/cm2; 2—E = 2.0 MeV, P = 4 kW/cm2; 3—E = 2.5 MeV, P = 8 kW/cm2; 4—E = 2.0 MeV, P = 6 kW/cm2; 5—E = 2.5 MeV, P = 10 kW/cm2.
Figure 19
Figure 19
A schematic representation of the relaxation of excitation energy in dielectrics (at the top) and metals (at the bottom).
Figure 20
Figure 20
Schematic representation of the transfer of excitation energy to heating in a dielectric.

References

    1. Liu X., Qian X., Zheng P., Chen X., Feng Y., Shi Y., Zou J., Xie R., Li J. Composition and Structure Design of Three-Layered Composite Phosphors for High Color Rendering Chip-on-Board Light-Emitting Diode Devices. J. Adv. Ceram. 2021;10:729–740. doi: 10.1007/s40145-021-0467-0. - DOI
    1. Xia Z., Meijerink A. Ce3+-Doped Garnet Phosphors: Composition Modification, Luminescence Properties and Applications. Chem. Soc. Rev. 2017;46:275–299. doi: 10.1039/C6CS00551A. - DOI - PubMed
    1. Li J., Sahi S., Groza M., Pan Y., Burger A., Kenarangui R., Chen W. Optical and Scintillation Properties of Ce3+-Doped LuAG and YAG Transparent Ceramics: A Comparative Study. J. Am. Ceram. Soc. 2017;100:150–156. doi: 10.1111/jace.14461. - DOI
    1. Lecoq P. Development of New Scintillators for Medical Applications. Nucl. Instrum. Methods Phys. Res. Sect. A Accel. Spectrometers Detect. Assoc. Equip. 2016;809:130–139. doi: 10.1016/j.nima.2015.08.041. - DOI - PMC - PubMed
    1. Sharma S.K., James J., Gupta S.K., Hussain S. UV-A,B,C Emitting Persistent Luminescent Materials. Materials. 2022;16:236. doi: 10.3390/ma16010236. - DOI - PMC - PubMed

LinkOut - more resources