

Insight into the Inhibitory Mechanism of Embryonic Ectoderm Development Subunit by Triazolopyrimidine Derivatives as Inhibitors through Molecular Dynamics Simulation
- PMID: 38138487
- PMCID: PMC10745707
- DOI: 10.3390/molecules28247997
Insight into the Inhibitory Mechanism of Embryonic Ectoderm Development Subunit by Triazolopyrimidine Derivatives as Inhibitors through Molecular Dynamics Simulation
Abstract
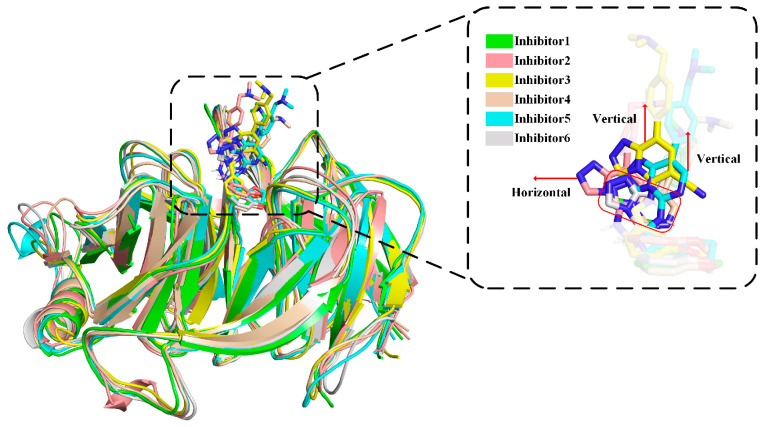
Inhibition of the Embryonic Ectoderm Development (EED) subunit in Polycomb Repressive Complex 2 (PRC2) can inhibit tumor growth. In this paper, we selected six experimentally designed EED competitive Inhibitors of the triazolopyrimidine derivatives class. We investigated the difference in the binding mode of the natural substrate to the Inhibitors and the effects of differences in the parent nuclei, heads, and tails of the Inhibitors on the inhibitory capacity. The results showed that the binding free energy of this class of Inhibitors was close to or lower compared to the natural substrate, providing an energetic basis for competitive inhibition. For the Inhibitors, the presence of a strong negatively charged group at the 6-position of the parent nucleus or the 8'-position of the head would make the hydrogen atom on the head imino group prone to flip, resulting in the vertical movement of the parent nucleus, which significantly decreased the inhibitory ability. When the 6-position of the parent nucleus was a nonpolar group, the parent nucleus would move horizontally, slightly decreasing the inhibitory ability. When the 8'-position of the head was methylene, it formed an intramolecular hydrophobic interaction with the benzene ring on the tail, resulting in a significant increase in inhibition ability.
Keywords: EED; MM/PBSA; inhibitory mechanism; molecular dynamics simulation; triazolopyrimidine derivatives.
Conflict of interest statement
The authors declare no conflict of interest.
Figures


Similar articles
-
Identification and Assessments of Novel and Potent Small-Molecule Inhibitors of EED-EZH2 Interaction of Polycomb Repressive Complex 2 by Computational Methods and Biological Evaluations.Chem Pharm Bull (Tokyo). 2020 Jan 1;68(1):58-63. doi: 10.1248/cpb.c19-00550. Epub 2019 Nov 1. Chem Pharm Bull (Tokyo). 2020. PMID: 31685780
-
Structure-Based Design of the Indole-Substituted Triazolopyrimidines as New EED-H3K27me3 Inhibitors for the Treatment of Lymphoma.J Med Chem. 2023 Jan 12;66(1):1063-1081. doi: 10.1021/acs.jmedchem.2c02028. Epub 2022 Dec 29. J Med Chem. 2023. PMID: 36580346
-
Embryonic Ectoderm Development (EED) as a Novel Target for Cancer Treatment.Curr Top Med Chem. 2021;21(31):2771-2777. doi: 10.2174/1568026621666210920154942. Curr Top Med Chem. 2021. PMID: 34544341 Review.
-
Recent strategies targeting Embryonic Ectoderm Development (EED) for cancer therapy: Allosteric inhibitors, PPI inhibitors, and PROTACs.Eur J Med Chem. 2022 Mar 5;231:114144. doi: 10.1016/j.ejmech.2022.114144. Epub 2022 Jan 20. Eur J Med Chem. 2022. PMID: 35093670 Review.
-
MicroRNA-323-3p regulates the activity of polycomb repressive complex 2 (PRC2) via targeting the mRNA of embryonic ectoderm development (Eed) gene in mouse embryonic stem cells.J Biol Chem. 2013 Aug 16;288(33):23659-65. doi: 10.1074/jbc.M113.475608. Epub 2013 Jul 2. J Biol Chem. 2013. PMID: 23821546 Free PMC article.
References
MeSH terms
Substances
Grants and funding
- 20220508114RC/Jilin Provincial Science and Technology Development Plan
- 2022171, 2023CX184/Jilin University Graduate Innovation Research Program Project
- KJLT202312/Jilin Provincial Association for Science and Technology Domestic and Foreign Academic Exchange Project
- JGJX2022D31/Jilin Province Higher Education Research Project
- 2022Q3/Jilin Provincial Social Science Foundation
LinkOut - more resources
Full Text Sources
