. 2023 Dec 8;16(24):7570.
doi: 10.3390/ma16247570.

Non-Destructive Characterization of Cured-in-Place Pipe Defects

Affiliations

Non-Destructive Characterization of Cured-in-Place Pipe Defects

Richard Dvořák et al. Materials (Basel). .

Abstract

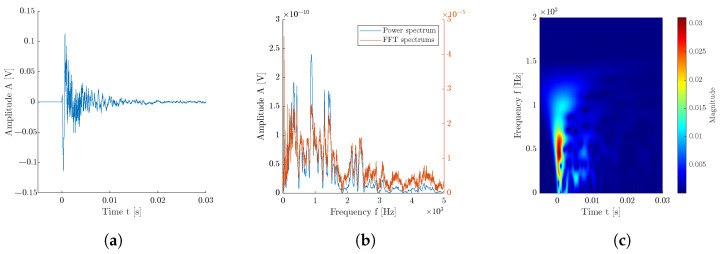
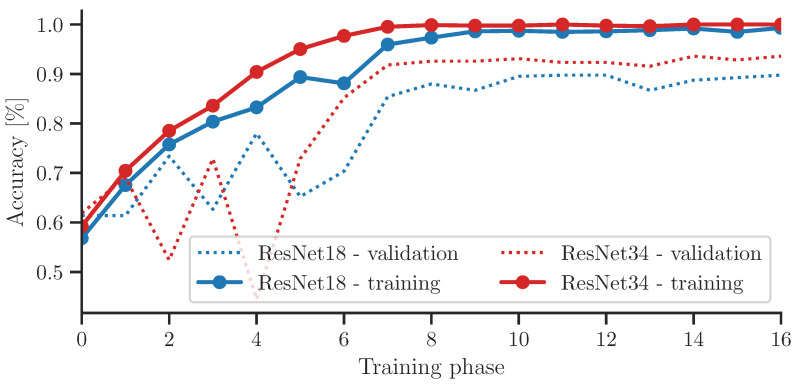
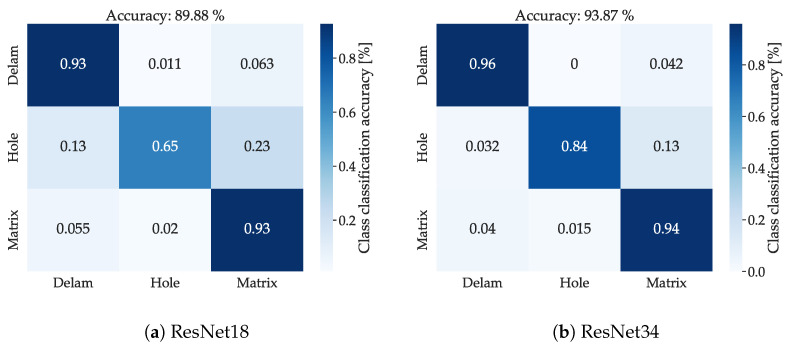
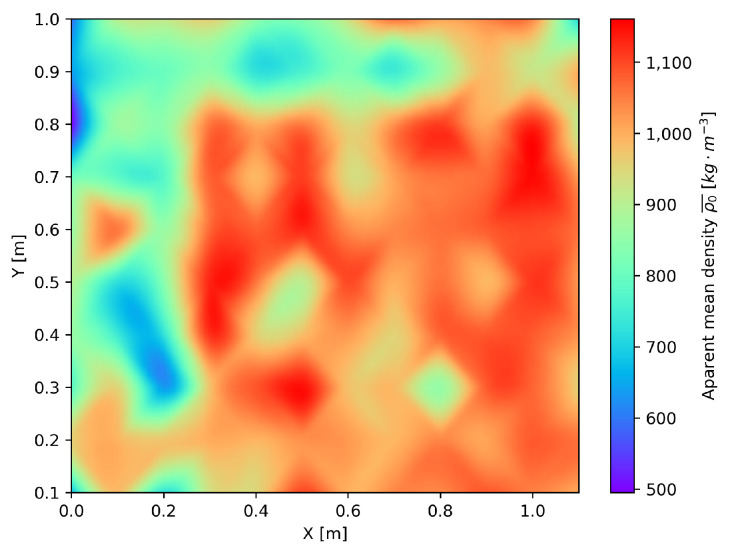
Sewage and water networks are crucial infrastructures of modern urban society. The uninterrupted functionality of these networks is paramount, necessitating regular maintenance and rehabilitation. In densely populated urban areas, trenchless methods, particularly those employing cured-in-place pipe technology, have emerged as the most cost-efficient approach for network rehabilitation. Common diagnostic methods for assessing pipe conditions, whether original or retrofitted with-cured-in-place pipes, typically include camera examination or laser scans, and are limited in material characterization. This study introduces three innovative methods for characterizing critical aspects of pipe conditions. The impact-echo method, ground-penetrating radar, and impedance spectroscopy address the challenges posed by polymer liners and offer enhanced accuracy in defect detection. These methods enable the characterization of delamination, identification of caverns behind cured-in-place pipes, and evaluation of overall pipe health. A machine learning algorithm using deep learning on images acquired from impact-echo signals using continuous wavelet transformation is presented to characterize defects. The aim is to compare traditional machine learning and deep learning methods to characterize selected pipe defects. The measurement conducted with ground-penetrating radar is depicted, employing a heuristic algorithm to estimate caverns behind the tested polymer composites. This study also presents results obtained through impedance spectroscopy, employed to characterize the delamination of polymer liners caused by uneven curing. A comparative analysis of these methods is conducted, assessing the accuracy by comparing the known positions of defects with their predicted characteristics based on laboratory measurements.

Keywords: cured-in-place pipes; machine learning; non-destructive testing; pipe defects; polymers; retrofitting.


Conflict of interest statement

The authors declare no conflict of interest.

Figures

Figure 1
Figure 1
Comparison of wastewater treatment plants accidents in Europe (Adapted from [4], with permission from Elsevier).
Figure 2
Figure 2
Example of in situ retrofitting action from Brno Lužánky park: (a) Image of the digged starting staff; (b) Image from inside the newly cured pipe in the old, damaged sewage pipe. Images taken by Prof. Luboš Pazdera.
Figure 3
Figure 3
The process of retrofitting action using cured-in-place pipe concept.
Figure 4
Figure 4
Illustration of CIPP retrofitting process.
Figure 5
Figure 5
Illustration of artificial wrapping defects on manufactured boards.
Figure 6
Figure 6
Generation of XY testing point coordinates: (a) Board B on sand bed; (b) Defects in sand bed; (c) Registered image of defects and board; (d) Final transformed XY testing point mesh.
Figure 7
Figure 7
Example of defects in the sand bed: (a) Board A1 green pipe ⌀ 150 mm, yellow pipe ⌀ 100 mm; (b) Board B1 green pipe ⌀ 150 mm, yellow pipe ⌀ 100 mm; (c) Board B2 green pipe ⌀ 150 mm, yellow pipe ⌀ 100 mm, blue metal can, white plastic bottle; (d) Board C2 green pipe ⌀ 150 mm, yellow pipe ⌀ 100 mm, blue metal can, white plastic bottle.
Figure 8
Figure 8
Illustration of IE experiment setup.
Figure 9
Figure 9
Example of a signal from class ‘Delamination’: (a) Measured signal; (b) Comparison of spectrum acquired by using FFT and by computing power spectrum; (c) Scalogram obtained by using continuous wavelet transformation.
Figure 10
Figure 10
Used GPR for the measurements: (a) Measuring card; (b) Measuring probe with antenna and tracking wheel.
Figure 11
Figure 11
Procedure of volumetric scanning with used georadar. First scans were done in Y axis, and subsequent scans were done to the right (green color). Second set of scans were don in X axis and subsequent scans were taken from bottom up (blue color).
Figure 12
Figure 12
Impedance probe DAK-12 used on tested board pieces. Image taken by Richard Dvořák.
Figure 13
Figure 13
Comparison of all acquired signals and their distribution across the selected classes.
Figure 14
Figure 14
Correlation plot of selected variables of measured signals: signal-to-noise ratio; crest factor; rise angle; signal energy.
Figure 15
Figure 15
Comparison of classification model accuracy for 4 groups: (a) All specimens (A1, B1, B2, C2); (b) Only specimens with same defects (A1, B1) and (c) (B2, C2); (d) Only specimens with different defects (A1, C2).
Figure 16
Figure 16
Comparison of representative signals of each Class: (a) Delam; (b) Hole; (c) Matrix. The red dots represent the dominant frequency of the spectrum, black triangles represents the total hits above the threshold value in signal analysis and other dominant frequencies in frequency spectrum. The Red line showing rise time of the signal, and total duration of the signal. Grey line represents dominant linear trend of other frequencies apart the dominant frequency.
Figure 17
Figure 17
Learning rate of used networks.
Figure 18
Figure 18
Confusion matrix of each of the used CNN for classification of IE data: (a) Network ResNet18; (b) Network ResNet34.
Figure 19
Figure 19
Cut-out specimens from Board A: (a) “Healthy” specimen without visible delamination; (b) Specimen with present delamination; (c) Specimen with highest delamination, also with wash-out epoxy resin. Images taken by Jan Puchýř.
Figure 20
Figure 20
Apparent density of cut-out specimens of Board A.
Figure 21
Figure 21
Results of impedance measurement: (a) Example of lowest (blue), middle (orange), and highest measured impedance (green); (b) Heat map of the distribution of impedance across the board.
Figure 22
Figure 22
Volumetric scan of Board B with defects type 1.
Figure 23
Figure 23
Distribution of GPR signal waves on the vertical cross-section of the sample.
Figure 24
Figure 24
Sequential steps of the algorithm that recognize objects on the data for Board B with Defect 1 from GPR: (a) Raw data for z=0.70 m; (b) Averaged data for dla z=0.70 m and b=5; (c) Matrix dall(xblur,yblur) matrix obtained for n=7 and t=0.3; (d) Recognized shapes (blue) versus originally found in the sample (red).
Figure 25
Figure 25
Sequential steps of the algorithm that recognize objects on the data for Board C with Defect 2 from GPR: (a) Raw data for z=0.70 m; (b) Averaged data for dla z=0.70 m and b=5; (c) Matrix dall(xblur,yblur) obtained for n=7 and t=0.3; (d) Recognized shapes (blue) versus originally found in the sample (red).

Similar articles

Cited by

References

    1. Kaushal V., Najafi M., Serajiantehrani R., Malek Mohammadi M., Shirkhanloo S. Pipelines 2022. American Society of Civil Engineers; Reston, VA, USA: 2022. Construction Cost Comparison between Trenchless Cured-in-Place Pipe (CIPP) Renewal and Open-Cut Replacement for Sanitary Sewer Applications; pp. 171–177.
    1. Patil R.R., Ansari S.M., Calay R.K., Mustafa M.Y. Review of the State-of-the-art Sewer Monitoring and Maintenance Systems Pune Municipal Corporation—A Case Study. TEM J. 2021;10:1500–1508. doi: 10.18421/TEM104-02. - DOI
    1. Coombes P., Micevski T., Kuczera G. Deterioration, depreciation and serviceability of stormwater pipes; Proceedings of the Stormwater Industry Association 2002 Conference on Urban Stormwater Management; Orange, NSW, Australia. 23–24 April 2002.
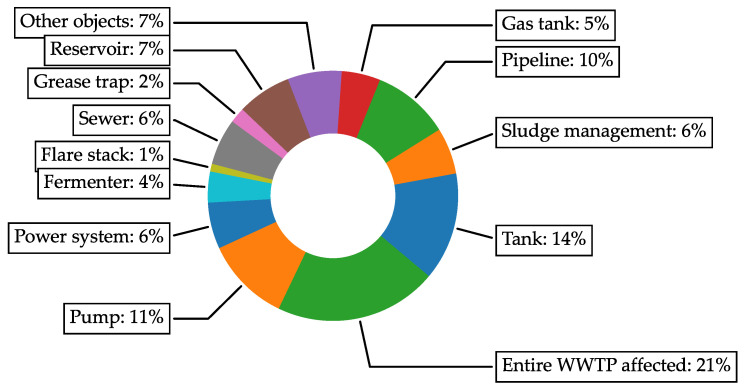
    1. Trávníček P., Junga P., Kotek L., Vítěz T. Analysis of accidents at municipal wastewater treatment plants in Europe. J. Loss Prev. Process. Ind. 2022;74:104634. doi: 10.1016/j.jlp.2021.104634. - DOI
    1. Alam S., Sterling R.L., Allouche E., Condit W., Matthews J., Selvakumar A., Simicevic J. A retrospective evaluation of the performance of liner systems used to rehabilitate municipal gravity sewers. Tunn. Undergr. Space Technol. 2015;50:451–464. doi: 10.1016/j.tust.2015.08.011. - DOI

LinkOut - more resources