Review
. 2023 Dec 18;16(24):7693.
doi: 10.3390/ma16247693.

Progress in Gallium Oxide Field-Effect Transistors for High-Power and RF Applications

Affiliations
Review

Progress in Gallium Oxide Field-Effect Transistors for High-Power and RF Applications

Ory Maimon et al. Materials (Basel). .

Abstract

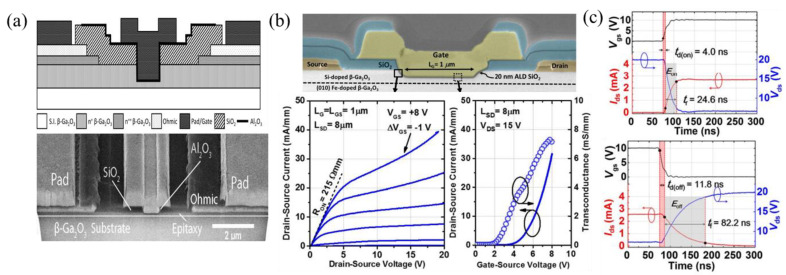
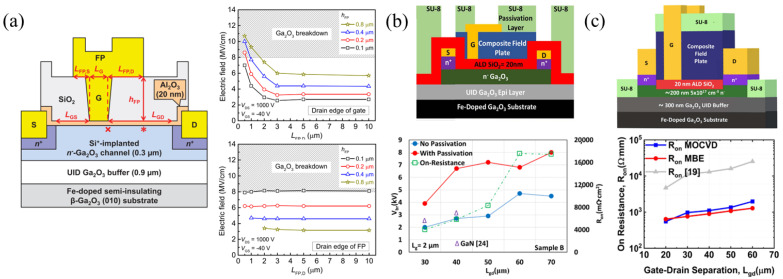
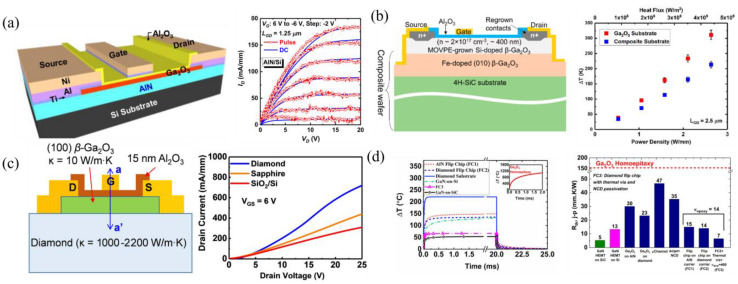
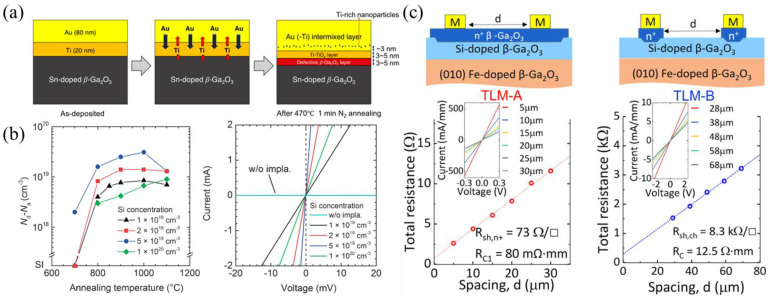
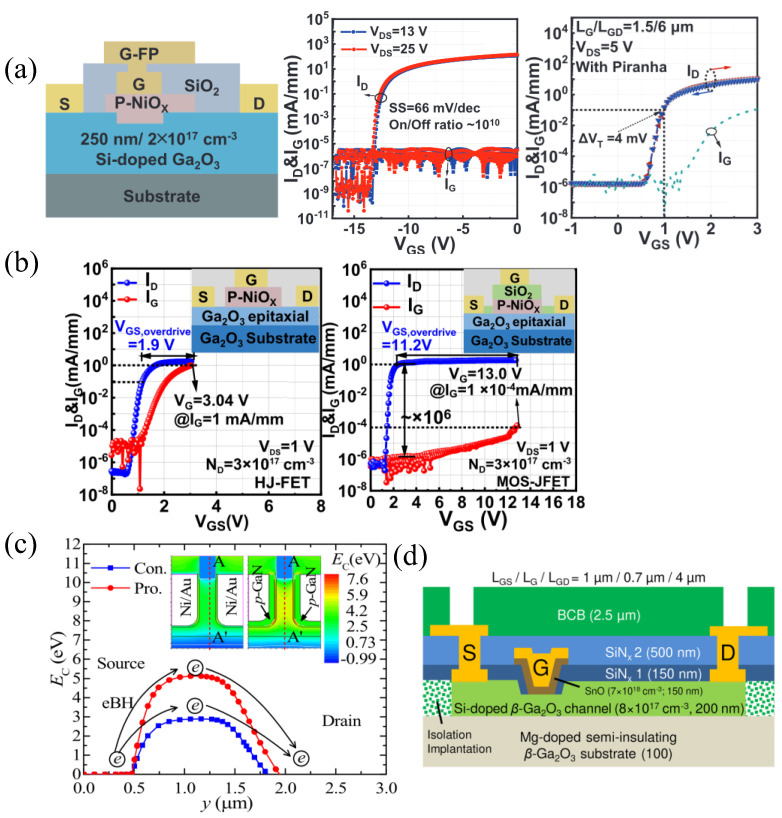
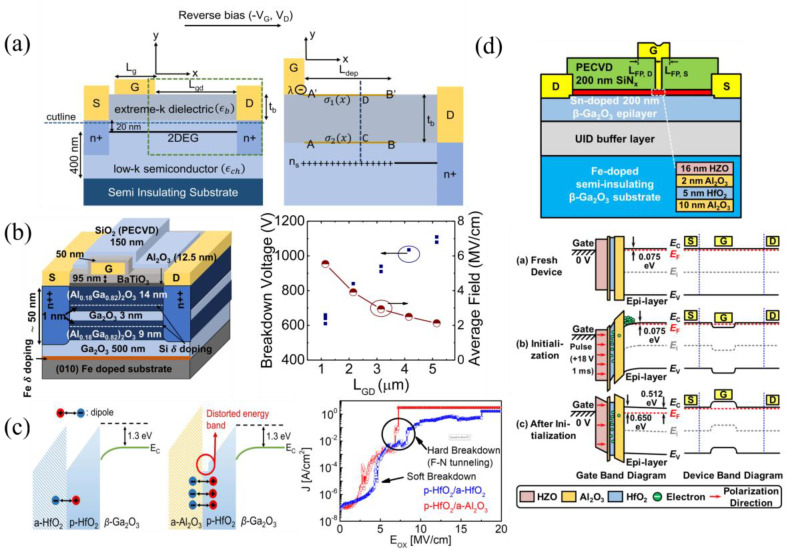
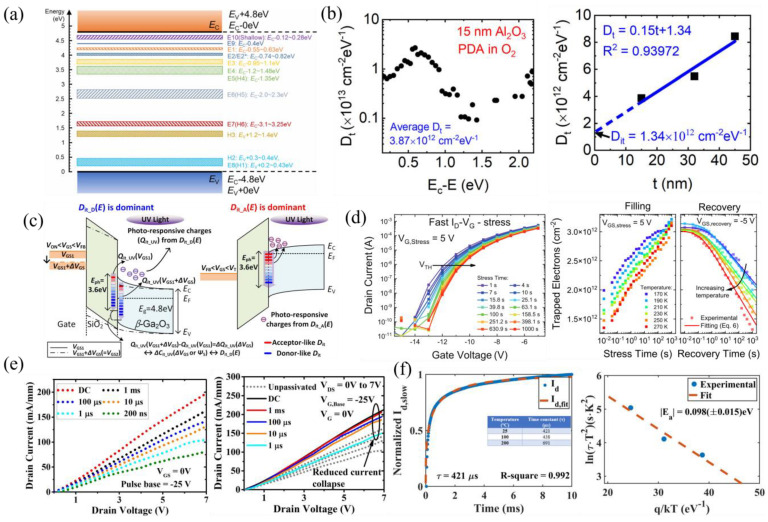
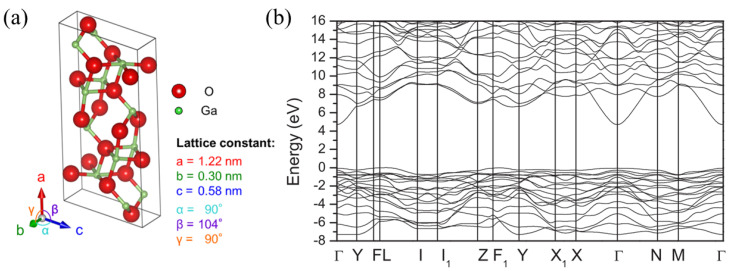
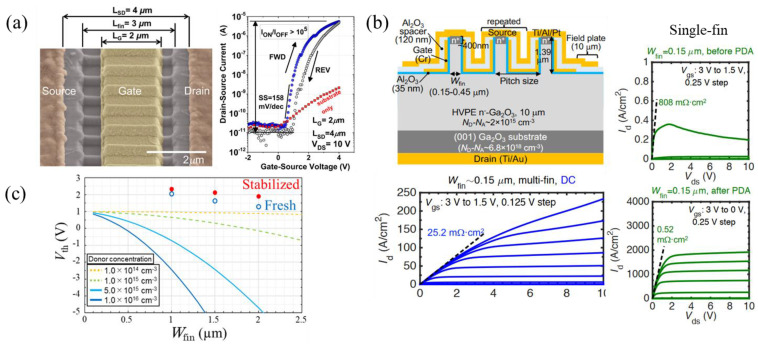
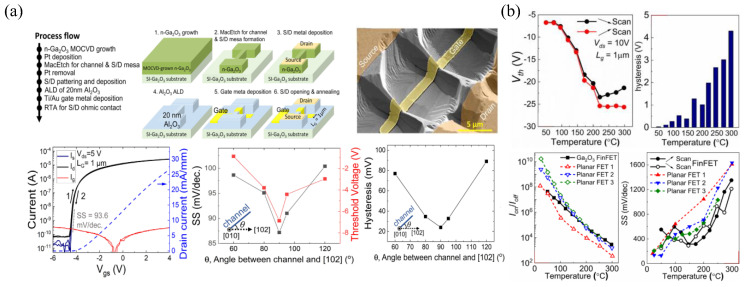
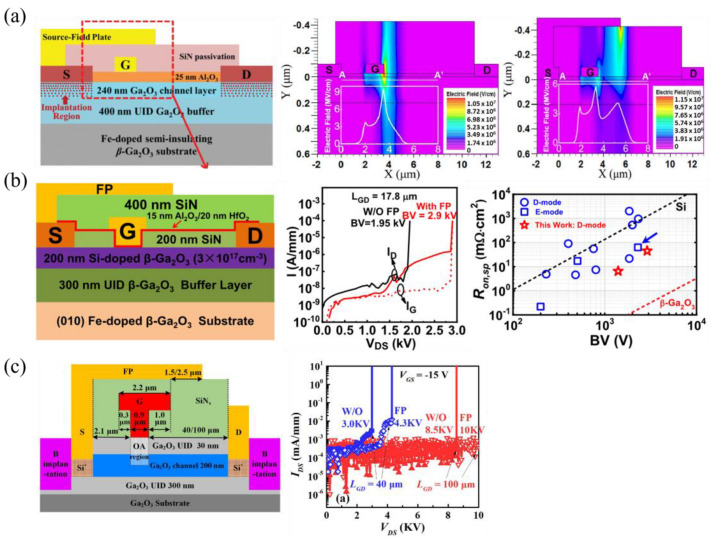
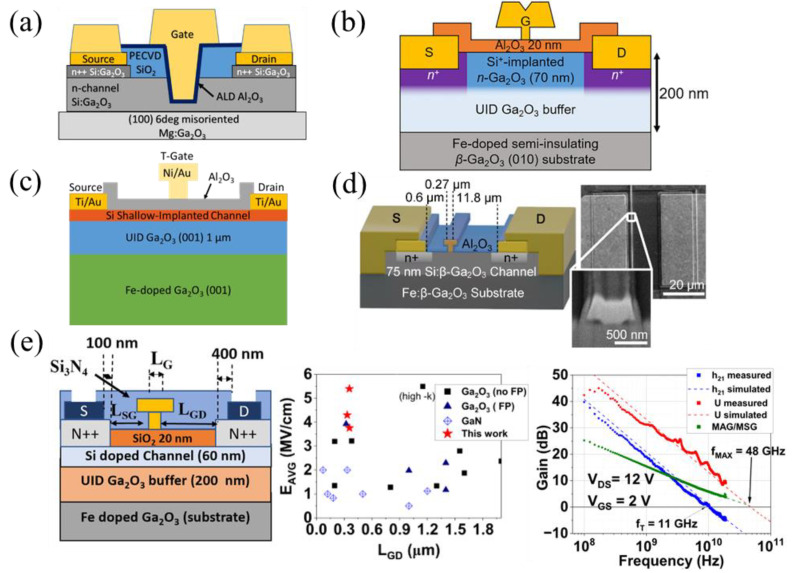
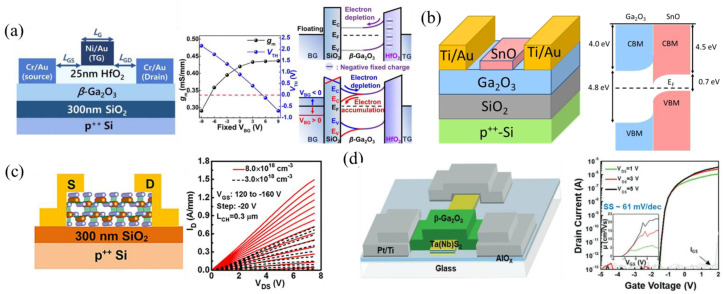
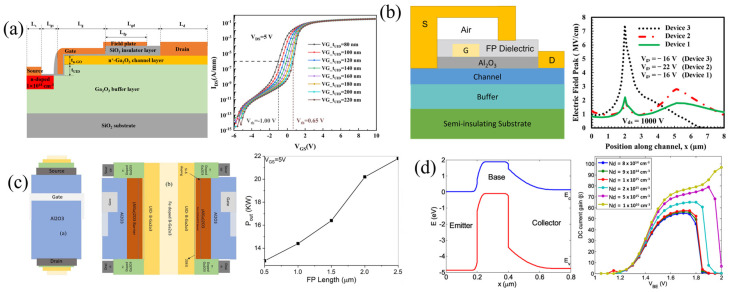
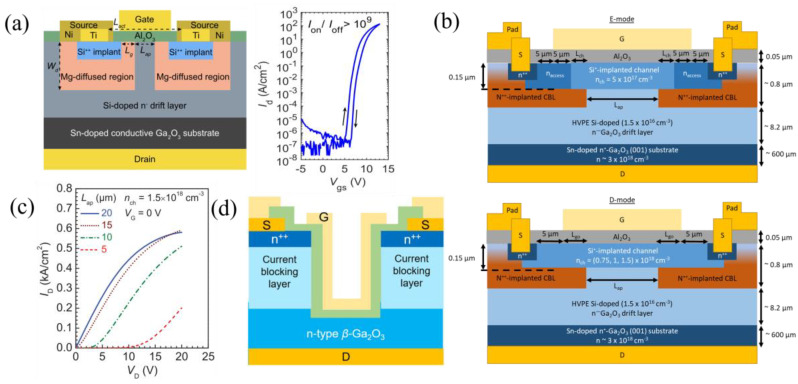
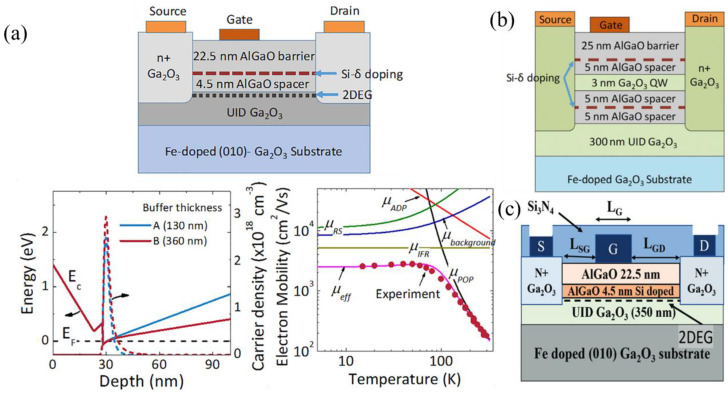
Power electronics are becoming increasingly more important, as electrical energy constitutes 40% of the total primary energy usage in the USA and is expected to grow rapidly with the emergence of electric vehicles, renewable energy generation, and energy storage. New materials that are better suited for high-power applications are needed as the Si material limit is reached. Beta-phase gallium oxide (β-Ga2O3) is a promising ultra-wide-bandgap (UWBG) semiconductor for high-power and RF electronics due to its bandgap of 4.9 eV, large theoretical breakdown electric field of 8 MV cm-1, and Baliga figure of merit of 3300, 3-10 times larger than that of SiC and GaN. Moreover, β-Ga2O3 is the only WBG material that can be grown from melt, making large, high-quality, dopable substrates at low costs feasible. Significant efforts in the high-quality epitaxial growth of β-Ga2O3 and β-(AlxGa1-x)2O3 heterostructures has led to high-performance devices for high-power and RF applications. In this report, we provide a comprehensive summary of the progress in β-Ga2O3 field-effect transistors (FETs) including a variety of transistor designs, channel materials, ohmic contact formations and improvements, gate dielectrics, and fabrication processes. Additionally, novel structures proposed through simulations and not yet realized in β-Ga2O3 are presented. Main issues such as defect characterization methods and relevant material preparation, thermal studies and management, and the lack of p-type doping with investigated alternatives are also discussed. Finally, major strategies and outlooks for commercial use will be outlined.

Keywords: RF; defects; field-effect transistors (FETs); gallium oxide; high power; wide-bandgap semiconductor.


Conflict of interest statement

The authors declare no conflict of interest. The funders had no role in the design of the study; in the collection, analyses, or interpretation of data; in the writing of the manuscript, or in the decision to publish the results.

Figures

Figure 5
Figure 5
(a) First recessed-gate FET reported with sub-µm LG. Reprinted with permission from [90]. (b) First E-mode recessed-gate FET and respective transfer and output curves. © (2018) IEEE. Reprinted with permission from [80]. (c) Switching characteristics of a recessed-gate lateral FET where turn-on delay time, td(on), is defined as the time between 0.1Vgs and 0.1Ids. Likewise, td(off) is the time between 0.9Vgs and 0.9Ids. Similarly, the rise time, tr, is the time between 0.1Ids and 0.9Ids, and the fall time, tf, is the time between 0.9Ids and 0.1Ids. © (2019) IEEE. Reprinted with permission from [114].
Figure 9
Figure 9
(a) GFP FET cross-section with the symbols x and * indicating peak electric fields in the channel. Plots of simulated breakdown electric field dependence on LFP,D and hFP are shown at the location of symbol x (top plot) and * (bottom plot). © (2016) IEEE. Reprinted with permission from [128]. (b) FET with composite PECVD-SiO2/ALD-SiO2 GFP and SU8 passivation used to increase Vbr. © (2020) IEEE. Reprinted with permission from [131]. (c) GFP FET similar to that in (b) but with SU8 as part of the FP and vacuum annealing, increasing Vbr and reducing Ron. © (2022) IEEE. Reprinted with permission from [64].
Figure 16
Figure 16
Thermal studies using AlN, SiC, and diamond. (a) SOI FET on an AlN/Si substrate showing effective heat dissipation when comparing DC and pulsed I-V. Reprinted from [71]. (b) SiC/GO composite wafer MOSFET with significant reduced temperatures at high power densities. Reprinted with permission from [72]. Copyright 2023 American Chemical Society. (c) MOSFET with diamond substrate and I-V curves compared to FETs, with other substrates showing significant current dispersion caused by self-heating. Reproduced from [73]. CC BY 4.0. (d) Simulation and comparison of device-level cooling methods. © (2019) IEEE. Reprinted with permission from [204].
Figure 17
Figure 17
(a) Formation of a defective β-Ga2O3 and TiOx layer enabling ohmic contacts. Reproduced from [207]; licensed under a Creative Commons Attribution (CC BY) license. (b) Effective doping vs. annealing temperatures of Si implantation and I-V curves for various Si concentrations after annealing at 950 °C. Reproduced from [214]. © The Japan Society of Applied Physics. Reproduced with the permission of IOP Publishing Ltd. All rights reserved. (c) Regrown ohmic contacts reducing contact resistance as shown through TLM measurements of the regrown layer (TLM-A) and to the channel layer (TLM-B). Reproduced from [107]. © The Japan Society of Applied Physics. Reproduced with the permission of IOP Publishing Ltd. All rights reserved.
Figure 18
Figure 18
(a) P-NiO-gated HJ-FET with BFOM of 0.74 GW cm−2, ultra-low SS, and negligible hysteresis due to piranha treatment. Reproduced from [75], with the permission of AIP Publishing. (b) Addition of SiO2 between gate metal and p-NiO increases pn turn-on and enables larger gate swing. © (2023) IEEE. Reprinted with permission from [76]. (c) EC electron barrier of FinFET with conventional (Con., blue) Ni/Au gate contact compared with proposed (pro., red) device using p-GaN as the gate metal, simulated through TCAD. Reproduced from [239]. © IOP Publishing. Reproduced with permission. All rights reserved. (d) HJ-FET with p-SnO-gate dielectric grown via PAMBE. Reproduced from [77]. CC BY 4.0.
Figure 19
Figure 19
(a) The charge profile after applying a negative gate bias on a 2DEG with an extreme-k BTO gate dielectric. © (2021) IEEE. Reprinted with permission from [78]. (b) Double-heterostructure AlGO/GO MODFET with low-k Al2O3/extreme-k BTO gate dielectric reaching average breakdown electric fields of 5.5 MV cm−1. © (2021) IEEE. Reprinted with permission from [79]. (c) Multi-stack gate dielectrics of p-HfO2/a-HfO2 with superior breakdown compared to the p-HfO2/a-Al2O3 stack. © (2021) IEEE. Reprinted with permission from [245]. (d) Ferroelectric charge storage due to multi-stack gates and polarization trapping by Hf0.5Zr0.5O2. Reproduced from [87], with the permission of AIP Publishing.
Figure 20
Figure 20
(a) Bulk trap levels found via DLTS and DLOS. Reproduced from [247]. © IOP Publishing. Reproduced with permission. All rights reserved. (b) PCV method using above-gap light for Dt and extrapolation to obtain an average Dit. Reproduced from [248], with the permission of AIP Publishing. (c) Photo I-V to obtain donor and acceptor interface trap state densities. © (2018) IEEE. Reprinted with permission from [250]. (d) Stress I-V and trapped charge from stress C-V. Reproduced from [251], with the permission of AIP Publishing. (e) Pulsed I-V showing current dispersion (left) without passivation and significant improvement after SiNx passivation (right). (f) Fitted I-V transient to variable range-hopping mechanism for time constant and temperature-dependent measurements for activation energy. © (2021) IEEE. Reprinted with permission from [133].
Figure 1
Figure 1
(a) β-Ga2O3 unit cell. Reproduced from [22]. © IOP Publishing. Reproduced with permission. All rights reserved. (b) β-Ga2O3 band diagram. Reprinted with permission from [19]. Copyright 2017 by the American Physical Society.
Figure 2
Figure 2
Electron mobility vs. carrier concentration in β-Ga2O3 for Si, Sn, and Ge dopants in layers grown using various crystal and thin film techniques. Adapted with permission from Chen et al. [31] © 2023 John Wiley & Sons, Ltd.
Figure 3
Figure 3
(a) First MESFET reported in 2013. Reproduced from [101], with the permission of AIP Publishing. (b) Shutter pulsing scheme and doping variation showing alternating UID and uniformly doped layers. Reproduced from [102]. © The Japan Society of Applied Physics. Reproduced with the permission of IOP Publishing Ltd. All rights reserved. (c) Highly scaled T-gate delta-doped MESFET with high cutoff and maximum frequencies. © (2019) IEEE. Reprinted with permission from [88]. (d) Tri-gate MESFETs with low-temp/high-temp grown layers resulting in ultra-high mobilities and negligible I-V hysteresis. © (2022) IEEE. Reprinted with permission from [63].
Figure 4
Figure 4
(a) SAG FET using refractory metal gate W and Si ion implantation for self-alignment with an LSG of 0 µm. The RF Pout, GT, and PAE as a function of input power at 1 GHz are plotted. Reproduced from [89]. CC BY 4.0. (b) SAG process enabled by using an n++ grown cap layer as opposed to ion implantation. High gate leakage and low on/off ratio are indicative of a leaky dielectric due to its deposition or residual Ga droplets at the interface. Reproduced from [61], with the permission of AIP Publishing.
Figure 6
Figure 6
(a) TCAD model of a recessed-gate FET studying variations in fermi level, Vth, and electron concentration with channel thickness. Reproduced from [115]; licensed under a Creative Commons Attribution (CC BY) license. (b) TCAD model of a recessed-gate FET studying variations in Vth and current density with doping and recess depth. Reprinted from [116], Copyright (2023), with permission from Elsevier. (c) A novel recessed-gate FET design with different body and drift layers recessing fully through the drift layer. Body-doping effects on E-/D-mode operation as well as a 2D cross-section of band bending through the body layer at low dopings. Reproduced from [117]. CC BY 4.0.
Figure 7
Figure 7
(a) Lateral E-mode FinFETs and transfer curves with observed substrate conduction due to free carriers at the semi-insulating substrate. Reproduced from [113]. CC BY 4.0. (b) Cross-section of vertical multi-fin FETs, I-V curves of a single-fin FET showing significant improvement through PDA, and multi-fin FET I-V curves. © (2019) IEEE. Reprinted with permission from [81]. (c) Nitrogen doping mitigating the Vth dependence on Wfin and maintaining E-mode operation for large Wfin. Reproduced from [121]. © The Japan Society of Applied Physics. Reproduced by permission of IOP Publishing Ltd. All rights reserved.
Figure 8
Figure 8
(a) FinFETs fabricated via MacEtch with process and TEM image. I-V curves as well as SS and hysteresis dependence on channel angle relative to [102] are shown. Channels perpendicular to [102] show the best performance. Reproduced from [125], with the permission of AIP Publishing. (b) Temperature dependence of Vth, hysteresis, on/off ratio, and SS in MacEtch FinFETs indicating thermal degradation of the interface and/or dielectric. Reprinted from [127], with the permission of AIP Publishing.
Figure 10
Figure 10
(a) Lateral MOSFET with SFP and simulated TCAD electric field profiles clearly showing field spreading and reduction in overall peak field value. © (2019) IEEE. Reprinted with permission from [137]. (b) FET with SFP and T-gate structure, breakdown I-V, and benchmark plot. © (2020) IEEE. Reprinted with permission from [65]. (c) FET with SFP, T-gate, oxygen annealing (OA), and B-implantation for device isolation. The blue/red lines represent an LGD of 40/100 µm and solid/open symbols represent without/with SFP. A breakdown of 10 kV is observed. © (2023) IEEE. Reprinted with permission from [59].
Figure 11
Figure 11
A variety of RF T-gate FETs are shown. (a) FET incorporates a recessed-gate architecture. Reprinted with permission from [139]. (b) FET uses air as the FP dielectric. Reprinted from [140], with the permission of AIP Publishing. (c) FET uses both an air FP dielectric and an ultra-thin implanted channel [94]. (d) FET incorporating Al2O3 surface and gate metal passivation. Reprinted from [66]. CC BY-NC-ND 4.0. (e) T-gate RF FET with SiNx passivation with highest-reported fmax and high breakdown field of 48 GHz and 5.4 MV cm−1, respectively. Reproduced from [93], with the permission of AIP Publishing.
Figure 12
Figure 12
(a) SOI FET with Vth modulation using constant back-gate voltage to accumulate or deplete the channel, while the top gate controls the device. © (2019) IEEE. Reprinted with permission from [152]. (b) SOI FET obtaining a record mobility of 191 cm2 V−1 s−1 using a floating p-SnO layer in the channel [85]. (c) SOI FET with a p++ back gate and doping of 8 × 1018 cm−3, measuring record currents of 1.5 A mm−1. Reprinted from [68], with the permission of AIP Publishing. (d) TMD high Schottky barrier gate with near-ideal SS of 61 mV dec−1 when using TaS2. Reprinted with permission from Kim et al. [160] © 2023 Wiley-VCH GmbH.
Figure 13
Figure 13
TCAD simulations of novel, not yet realized β-Ga2O3 FETs. (a) An FP self-aligned trench vertical gate with variable Vth based on gate trench thickness into the UID layer, tUID. © (2023) IEEE. Reprinted with permission from [166]. (b) SFP with air gap dielectric to better mitigate electric fields at device edges. Reprinted with permission from [168], Copyright Elsevier (2022). (c) GAA FET with 2DEG to improve Pout and fT. Reprinted with permission from [169], Copyright Elsevier (2021). (d) Band diagram and current gain of npn HBT using p-CuO2, but limited by p-oxide bandgap, interface traps, and CBO between emitter and base. Reproduced from [170]. © IOP Publishing. Reproduced with permission. All rights reserved.
Figure 14
Figure 14
(a) Cross-section and transfer I-V curve of E-mode CAVET with CBL surrounding source. Copyright (2022) IEEE. Reprinted with permission from [83]. (b) E-/D-mode CAVETs implemented via nch variation [174]. (c) I-V output curves of CAVETs with different Lap showing diode-like turn-on behavior. Reproduced from [176], with the permission of AIP Publishing. (d) U-MOSFET with CBL. Reproduced from [84], with the permission of AIP Publishing.
Figure 15
Figure 15
(a) Cross-section band diagram showing 2DEG and measured mobility up to 180 cm2 V−1 s−1 at room temperature of an AlGO/GO MODFET using delta doping. Reproduced from [187], with the permission of AIP Publishing. (b) Cross-section of a double-heterostructure MODFET. Reproduced from [189], with the permission of AIP Publishing. (c) Cross-section of a heterostructure FET. Reproduced from [96], with the permission of AIP Publishing.
Figure 21
Figure 21
(a) Si concentration peak at the substrate/epi interface. Reproduced from [216]. © The Japan Society of Applied Physics. Reproduced with the permission of IOP Publishing Ltd. All rights reserved. (b) Negative effects of impurities from semi-insulating substrates and back depletion on mobility, charge density, and current dispersion. Reproduced from [103], with the permission of AIP Publishing. (c) Mg delta doping at substrate/epi interface to compensate Si impurities and reduce leakage current. Reproduced from [106], with the permission of AIP Publishing. (d) Buffer traps at EC—0.77 eV only for a 100 nm buffer, and at EC—0.70 eV for both a 100 nm and 600 nm buffer using CID-DLTS. Reproduced from [105], with the permission of AIP Publishing.
Figure 22
Figure 22
(a) Effects of PDA and PMA on Vfb and Dit. PMA shows improvement in both reducing fixed charge and shallow Dit, while having little effect on deep Dit. Reproduced from [249], with the permission of AVS: Science & Technology of Materials, Interfaces, and Processing. (b) First and second C-V sweeps of MOSCAPs with different surface cleans. SPB with FG-PDA introduces the least interface defects relative to the others. Reprinted with permission from [228]. (c) PCV comparing SRE to TMAH for removing ICP damage. Reproduced from [257], with the permission of AIP Publishing.

Similar articles

Cited by

References

    1. Technavio Wide-Bandgap (WBG) Power Semiconductor Devices Market Analysis 2026. [(accessed on 15 October 2023)]. Available online: https://www.technavio.com/report/wide-bandgap-wbg-power-semiconductor-de....
    1. Reese S.B., Remo T., Green J., Zakutayev A. How Much Will Gallium Oxide Power Electronics Cost? Joule. 2019;3:903–907. doi: 10.1016/j.joule.2019.01.011. - DOI
    1. Millan J., Godignon P., Perpina X., Perez-Tomas A., Rebollo J. A Survey of Wide Bandgap Power Semiconductor Devices. IEEE Trans. Power Electron. 2014;29:2155–2163. doi: 10.1109/TPEL.2013.2268900. - DOI
    1. Chow T., Tyagi R. Wide bandgap compound semiconductors for superior high-voltage unipolar power devices. IEEE Trans. Electron Devices. 1994;41:1481–1483. doi: 10.1109/16.297751. - DOI
    1. Pearton S.J., Ren F., Tadjer M., Kim J. Perspective: Ga2O3 for ultra-high power rectifiers and MOSFETS. J. Appl. Phys. 2018;124:220901. doi: 10.1063/1.5062841. - DOI

LinkOut - more resources