

Correlation between Topographic Vessel Density and Retinal Thickness Changes in Patients with Diabetic Macular Edema Treated with Anti-VEGF Therapy: Is It a Suitable OCTA Biomarker?
- PMID: 38138945
- PMCID: PMC10744775
- DOI: 10.3390/jpm13121718
Correlation between Topographic Vessel Density and Retinal Thickness Changes in Patients with Diabetic Macular Edema Treated with Anti-VEGF Therapy: Is It a Suitable OCTA Biomarker?
Abstract
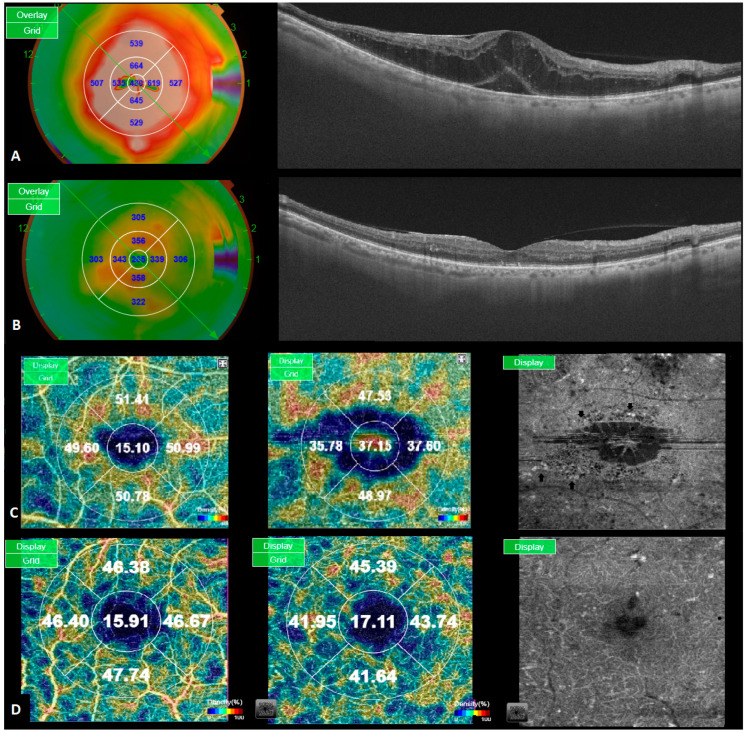
The objective of this study was to determine the correlation between topographic vessel density (VD) and retinal thickness (RT) reductions induced by vascular endothelial growth factor inhibitors (anti-VEGF) in patients with diabetic macular edema (DME) using optical coherence tomography angiography (OCTA). This was a prospective, interventional case series. VD and RT measurements were separately taken in four parafoveal subfields at baseline and after six months of treatment. This correlation was statistically assessed using Spearman's rho correlation coefficient after adjustment for multiple comparisons. The study included a total of 48 eyes in the final analysis. Mean VD decreased from baseline to month 6 (from 45.2 (±3.5) to 44.6% (±3.2) in the superficial capillary plexus and from 50 (±3.3) to 49% (±3.9) in the deep capillary plexus). Statistically significant reductions in RT were observed in all ETDRS sectors (p < 0.0001). No significant association was found between RT and VD, even when analyzing responders and non-responders separately. After six months of anti-VEGF treatment, no significant correlation was observed between the topographic VD and RT values. These findings suggest that reductions in VD values may not solely result from a reduction in microaneurysms, also being affected by the repositioning of displaced vessels due to edema and a reduction in their caliber. Therefore, VD changes may not be a suitable indirect OCTA biomarker of microaneurysm turnover and treatment response.
Keywords: anti-VEGF inhibitors; diabetic macular edema; optical coherence tomography angiography; vessel density.
Conflict of interest statement
The authors declare no conflict of interest.
Figures

References
-
- Perais J., Agarwal R., Evans J.R., Loveman E., Colquitt J.L., Owens D., Hogg R.E., Lawrenson J.G., Takwoingi Y., Lois N. Prognostic factors for the development and progression of proliferative diabetic retinopathy in people with diabetic retinopathy. Cochrane Database Syst. Rev. 2023:9–11. doi: 10.1002/14651858.CD013775.pub2. - DOI - PMC - PubMed
-
- Falavarjani K.G., Habibi A., Anvari P., Ghasemizadeh S., Khorasani M.A., Shenazandi H., Sarraf D. Effect of segmentation error correction on optical coherence tomography angiography measurements in healthy subjects and diabetic macular oedema. Br. J. Ophthalmol. 2020;104:162–166. doi: 10.1136/bjophthalmol-2019-314018. - DOI - PubMed
