

Comparative Analyses of Reproductive Caste Types Reveal Vitellogenin Genes Involved in Queen Fertility in Solenopsis invicta
- PMID: 38138959
- PMCID: PMC10743176
- DOI: 10.3390/ijms242417130
Comparative Analyses of Reproductive Caste Types Reveal Vitellogenin Genes Involved in Queen Fertility in Solenopsis invicta
Abstract
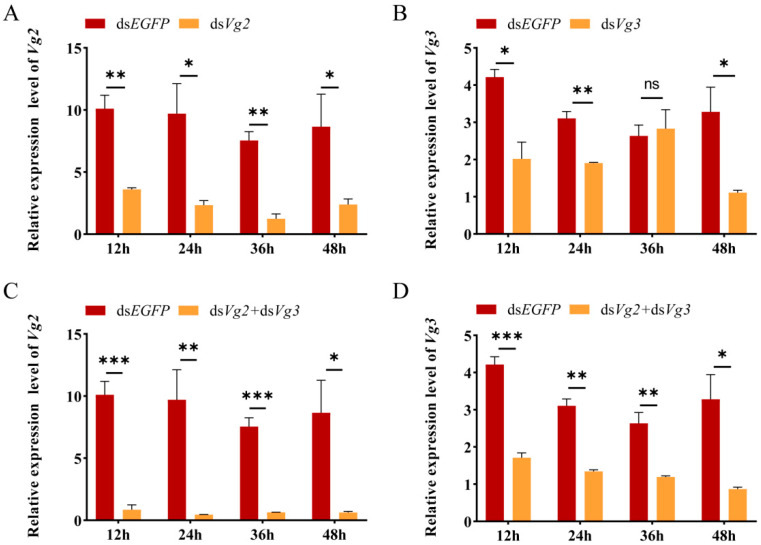
The red imported fire ant (Solenopsis invicta Buren) is a social pest species with a robust reproductive ability that causes extensive damage. Identification of the genes involved in queen fertility is critical in order to better understand the reproductive biology and screening for the potential molecular targets in S. invicta. Here, we used the mRNA deep sequencing (RNA-seq) approach to identify differentially expressed genes (DEGs) in the transcriptomes of three reproductive caste types of S. invicta, including queen (QA) and winged female (FA) and male (MA) ants. The genes that were specific to and highly expressed in the queens were then screened, and the Vg2 and Vg3 genes were chosen as targets to explore their functions in oogenesis and fertility. A minimum of 6.08 giga bases (Gb) of clean reads was obtained from all samples, with a mapping rate > 89.78%. There were 7524, 7133, and 977 DEGs identified in the MA vs. QA, MA vs. FA, and FA vs. QA comparisons, respectively. qRT-PCR was used to validate 10 randomly selected DEGs, including vitellogenin 2 (Vg2) and 3 (Vg3), and their expression patterns were mostly consistent with the RNA-seq data. The S. invicta Vgs included conserved domains and motifs that are commonly found in most insect Vgs. SiVg2 and SiVg3 were highly expressed in queens and winged females and were most highly expressed in the thorax, followed by the fat body, head, and epidermis. Evaluation based on a loss-of-function-based knockdown analysis showed that the downregulation of either or both of these genes resulted in smaller ovaries, less oogenesis, and less egg production. The results of transcriptional sequencing provide a foundation for clarifying the regulators of queen fertility in S. invicta. The functions of SiVg2 and SiVg3 as regulators of oogenesis highlight their importance in queen fecundity and their potential as targets of reproductive disruption in S. invicta control.
Keywords: Solenopsis invicta; Vgs; fertility; oogenesis; transcriptome.
Conflict of interest statement
The authors declare no conflict of interest.
Figures


Similar articles
-
Juvenile hormone induces reproduction via miR-1175-3p in the red imported fire ant, Solenopsis invicta.Insect Sci. 2024 Apr;31(2):371-386. doi: 10.1111/1744-7917.13291. Epub 2023 Nov 6. Insect Sci. 2024. PMID: 37933419
-
Expression analysis of vitellogenins in the workers of the red imported fire ant (Solenopsis invicta).PeerJ. 2018 May 28;6:e4875. doi: 10.7717/peerj.4875. eCollection 2018. PeerJ. 2018. PMID: 29868280 Free PMC article.
-
Vitellogenin underwent subfunctionalization to acquire caste and behavioral specific expression in the harvester ant Pogonomyrmex barbatus.PLoS Genet. 2013;9(8):e1003730. doi: 10.1371/journal.pgen.1003730. Epub 2013 Aug 15. PLoS Genet. 2013. PMID: 23966882 Free PMC article.
-
The genome of the fire ant Solenopsis invicta.Proc Natl Acad Sci U S A. 2011 Apr 5;108(14):5679-84. doi: 10.1073/pnas.1009690108. Epub 2011 Jan 31. Proc Natl Acad Sci U S A. 2011. PMID: 21282665 Free PMC article.
-
GPCR annotation, G proteins, and transcriptomics of fire ant (Solenopsis invicta) queen and worker brain: An improved view of signaling in an invasive superorganism.Gen Comp Endocrinol. 2019 Jul 1;278:89-103. doi: 10.1016/j.ygcen.2018.12.008. Epub 2018 Dec 18. Gen Comp Endocrinol. 2019. PMID: 30576645
Cited by
-
High Antennal Expression of CYP6K1 and CYP4V2 Participate in the Recognition of Alarm Pheromones by Solenopsis invicta Buren.Insects. 2025 Jan 5;16(1):43. doi: 10.3390/insects16010043. Insects. 2025. PMID: 39859624 Free PMC article.
-
Fire ant ovary gene expression analyses revealed immune and insulin pathways underlie the reproductive transition from virgin to mated queen.BMC Genomics. 2025 Aug 8;26(1):735. doi: 10.1186/s12864-025-11900-7. BMC Genomics. 2025. PMID: 40781584 Free PMC article.
References
-
- Li D.X., Li Z.X., Wang X.X., Wang L., Khoso A.G., Liu D.G. Climate change and international trade can exacerbate the invasion risk of the red imported fire ant Solenopsis invicta around the globe. Entomol. Gen. 2023;43:315–323. doi: 10.1127/entomologia/2023/1686. - DOI
-
- Wang L., Xu Y.J., Zeng L., Lu Y.Y. Impact of the red imported fire ant Solenopsis invicta Buren on biodiversity in South China: A review. J. Integr Agric. 2019;18:788–796. doi: 10.1016/S2095-3119(18)62014-3. - DOI
MeSH terms
Substances
Grants and funding
LinkOut - more resources
Full Text Sources
